Securities Research Services

Monday, December 04, 2006

Energy Heating Up

As we predicted it might, the QQQQ finally broke its uptrend line during Friday's session. The day must be considered a distribution day due to heavy volume flow. Nevertheless, tops take time to build and we could possibly see another spike higher before any real declines set in. How far the broad market will decline is up for debate, but we have very likely seen as much upside as we are going to see until we first get some form of a correction. When commodities are performing so well, who cares what the broader market is doing though? That is unless you are married to a stock and refuse to shift with the tides as they shift the sand below your positions. Oil prices continue to firm up at their current levels and oil stocks are providing some of the best set ups we have seen in some time. One note to keep in mind related to the energy sector. The sector in general is high beta, which means that reactions to incoming data are magnified several fold. If you keep focused on the bigger energy trend and refuse to pay heed to the day-to-day wild fluctuations that this sector is famous for, there are many opportunities presenting themselves here. On the other hand, if you let the market noise get to you and you narrow your focus too much, then you are likely to get shaken out of a good position right before it makes a strong move higher. When trading this sector it is best to keep stops loose, trading on end-of-day prices rather than paying too much attention to what happens mid day. Note for subscribers: We sent out both long term and short term recommendations today. Please check your email.

Friday, December 01, 2006

Broad Market Trend May be in Trouble

Selling pressure in the broader market, which received some relief on Wednesday, once again returned yesterday. This puts the 4-month QQQQ trend in jeopardy.
On the intraday QQQQ chart above we have drawn out a potential scenario that may unfold if buyers don't return today. Longer term the picture remains bullish, but the immediate picture is starting to look fairly bearish here. Meanwhile, the oils and metals are in great shape. A strong correction on the broader market may ruffle these sectors temporarily, but any dips in the commodities should be considered buying opportunities.

Thursday, November 30, 2006

Tuesday was but an Aberration

Tuesday's hard dip, it turns out, was just an aberration in an ongoing strong uptrend. Weak hands were shaken out and new shorts were put on, but the market continues to move forward. Short positions are likely to be covered higher, further driving prices higher from here. Likewise, performance chasing fund managers are likely to run this market higher into the end of the year. We will worry about January's tax selling in January. For now, this market remains hot and oil has taken over as the market leader once again.

Wednesday, November 29, 2006

Looking for Consolidation

Dip buying was aggressive yesterday, but their remains pressure from European profit takers, which should keep the market in back-and-fill mode over the rest of the week. From the European perspective the market has been in a correction since the dollar started falling heavily last week. The US market in Euros is quite a different picture than it is in dollars. Nevertheless, the discrepancies should even out over the next week as we are seeing good accumulation take place into the dips. The gold and oil sectors remain under heavy accumulation and moves in both these commodities could last into next year. Blue chip stocks are also in good shape here and as early as next week we should start to see new highs being reached.

Monday, November 27, 2006

QQQQ still in Line for $45.50

With the short week last week and the light volume on Friday, data from last week's close is not reliable. As such, we will withhold comments on market conditions today. We will say that while the market is vulnerable to a good hard pullback event, overall the trend is in great shape and sharp pullbacks may prove to be buying opportunities. For now, however, we continue to look for the QQQQ to run to $45.50, where it has significant resistance.

Wednesday, November 22, 2006

Holiday Rally Underway

Whether or not we are nearing the end game for this bull run, stocks and the market in general are looking very healthy here. In fact, momentum has a chance to pick up significantly with market's in the East now in strong rally mode (even Japan, which until yesterday had been quite weak). Dell is up 9% after hours, which should spark a fire under the NASDAQ. Unless we get a sell-the-news response, it's a good idea to stay long and enjoy the profits. We wish everyone a Happy Thanksgiving! Have a great weekend. We will reopen for business on Monday after the holiday weekend.

Tuesday, November 21, 2006

Broad Market Trend Showing Signs of Aging

Not much has changed since Friday's trading, so we will keep this brief and just summarize the current environment.

The QQQQ has a likely target of $45.30-$45.50. Given the money flow erosion on the Dow and the fact that other world markets are now breaking down (Japan in particular), it is important to not open any new long positions in the broader market here. We recommend focusing instead on the commodity sectors, which seem to have more potential at this late stage in the game.

Monday, November 20, 2006

Holiday Week Tends Towards Bullishness

We have a holiday week this week, so volume should start to thin out on Wednesday and be virtually non-existent on Friday when the market reopens. Nevertheless, last year the market was able to extend its gains during Thanksgiving week, and with the technical picture looking remarkably similar, we would not rule out a continuation of the current rally as we approach the holidays this year as well. We do recommend that everyone start moving more of their money into commodities. Oil has been a dog during the market rally, but is now oversold and firming up nicely. Some of the major oil companies like XOM and WMB have in fact broken out even as the price of oil has been testing its lows. This divergence tells us that the price of oil is likely to make a comeback and disappoint the oil bears who continue to doubt the long term energy trend.

Friday, November 17, 2006

Sitting Tight Through Today's Expiration

The QQQQ continues to be due for a pull back to its uptrend line provided in Wednesday's report. Continued gains from this level without a pull back make for an unstable climb, which would leave it more vulnerable for a hard correction. Despite the fact that this trend has been alive for longer than we have been used to trends lasting over the past couple of years, most technicals are in pretty good shape. Beyond that, we will refrain from calling a top. So many analysts continue to call for a top and as such have kept their followers from participating in this trend. Stops will take us out when the trend reverses. Once again, price is king and price remains solidly up.

As for today, today is options expiration and we tend to like to sit back and wait out this day each month. Options week is hard enough to navigate and on the day of expiration, price action can be even more meaningless. Next week is a short week as well, so it's a good idea to manage open positions and not open anything new unless something extraordinary presents itself.

Have a great weekend everyone!

Thursday, November 16, 2006

Charts Continue to Look Healthy, but Expect Consolidation

The QQQQ may have made a near term top. Sentiment has grown overly bullish and yesterday's Fed meeting minutes took some steam out of the move late in the day. We still think that the probabilities are better than even that the QQQQ will test $45.50 over the next few weeks. Be slow to become bearish here. We suspect that the top the QQQQ made yesterday will likely turn out to be similar to the tops made on both October 16 and October 26. A sharp pullback here would do a good job at taking the wind out of the bull's sails, giving the dip buyers a chance to get back in again at lower prices. As long as the charts in our scans continue to look healthy, we plan to stay bullish. Price means much more than all other arguments and price remains bullish. Note: A long term selection was sent to subscribers today via email.

Wednesday, November 15, 2006

QQQQ Has Room to Move

The market followed through higher yesterday. Of particular interest is the fact that the semi conductors and small caps broke out. Certainly this rally is nearing its end stages. Nevertheless, the trend is still up and top calling has been killing the speculators for months now. We think we have some insight into where this market may be headed over the next few weeks. The QQQQ seems to be providing clues to those paying attention. First, yesterday's rally put the QQQQ back at overhead channel resistance. The S&P and Dow both have some room to move, but the QQQQ at the very least needs to correct by trading sideways for a few days in order to maintain the parameters of the trend that has been in place since August.

From the chart above you can see that the immediate trend doesn't have much more room to spare before a correction takes place. Panning back to a 5-year view however note that the QQQQ is gunning for its overhead channel resistance. Sine 2004 the channel top drawn on the chart below has been turning back the QQQQ. Over the coming weeks this resistance area of $45.50 should act as a price magnet. What happens after the QQQQ reaches this area is anyone's best guess. It is interesting to note, however, that the S&P and Dow have both taken out their overhead channel resistance and are continuing higher. It's too early to know if this has any real significance. For now though, the trend remains friendly to bulls.

Tuesday, November 14, 2006

Maximum Pain Could be Painful for Bulls Friday

The QQQQ pushed slightly over resistance yesterday. However, options expire on Friday and far too many bulls are holding profitable call options at this point. This means that bulls are likely to feel some pain this week as options sellers attempt to park the car in the garage of maximum pain this week. When dealing with major resistance, first breakout attempts often fail. A sideways correction that lasts a few weeks may be necessary to work off some of the overbought condition. For now though it's best to avoid chasing breakouts. Dip buying this week may continue to be profitable however.

Monday, November 13, 2006

Outlook Grows Surprisingly Bullish

Over the weekend we scanned stocks making fresh 52-week highs and then we examined these stocks from four separate time frames. We were quite surprised by the results. A little background is in order before we get into more details though. Mid summer this year the market outlook was about as dire as it had been in some time. The market for two years had been bumping up against overhead resistance and was contained in a depressingly tight range, which made trend trading all but impossible to profit from. The first part of this year had the market in a steady decline, which made it look as if the Fed's interest rate hikes were about to send the market into the next leg down from the bear market which had begun in 2001. Just when it looked like the bottom was about to fall out though, stocks rallied. The rally had many problems in its early stages, which we pointed out in detail in this report. However, as the rally continued, it firmed up and stocks started to behave better than we have seen them behave over the past two years that the market has been caught in its trading range. Getting back to this weekend's scans. Scan criteria included: stocks that are trading between $1-$50; which trade at least 250,000 shares per day; which are also making fresh 52-week highs. An astounding 489 stocks met these parameters. This is up from only 50-60 just a few months ago. Nevertheless, the QQQQ is back at major overhead resistance and the market is overbought. This gives us some pause. What perked up our interest even more though was when we scanned through each of these 489 stocks on their 5-year weekly charts. What we found when we did this were not a group of stocks undergoing distribution and bumping up against resistance. Instead, we found a large majority of these stocks already breaking out to fresh 5-year highs; trading firmly above resistance. Moreover, most of these stocks are not in the process of exhaustion-type moves, but are instead just steadily moving up on solid volume and solid technicals. Keeping our feet on the ground. We can't lose our heads here and grow Pollyannaish about the future outlook since this market remains due for a correction. But, if the QQQQ can keep chipping away at resistance and if the group of leaders in our scans can continue to build on their gains over the next couple of weeks, we may indeed be looking at the onset of a major multi-year bull move, the likes of which we have not enjoyed for two grueling years. We are keeping our fingers crossed and will admit we were wrong if bullish moves start to fail this week.

Thursday, November 09, 2006

Market Continues to Rally

The election didn't slow buyers down and tech was under heavy accumulation yesterday. The QQQQ has a decent chance of breaking out to new highs from these levels. If it can muster continued buyer support and close over $43.20 for the week at some point this month, we would then likely see the rally into January. A QQQQ breakout would give buyers confidence to start buying up the high beta small caps once again, giving us more faster moving stocks to choose from. Right now the main strength remains in the big caps so patience is needed. Note: We will be taking tomorrow off.

Wednesday, November 08, 2006

Government Gridlock Likely Priced In

Democrats took over the lower house and as of the time of this writing, have a fair chance at taking over the Senate. The election outcome was in line with the latest polling results so the outcome is likely priced in to the market. Today's early trading might see a bit of selling by those convinced that a democratic congress is going to lead to bigger government and more spending. By late morning or early afternoon this should be muted or reversed. A democratic congress provides the nation with two years of gridlock; an outcome that will most likely put a cap on the big spending that has been taking place. While the election outcome is not likely to be the catalyst which launches the market toward its next move, now that the market has one less "unknown" behind it, business as usual can now get underway. Blue chips, which led the way up, are now undergoing distribution so we may be very near a correction. How big of a correction remains to be seen. With the recession now less probable than before Friday's employment report, the long term market outlook is less bearish. This however does not mean that the market cannot return to the summer lows before it rallies back up again.

Tuesday, November 07, 2006

Dull Day Likely

Today's price action should be muted as the market awaits election results. Gridlock is what the market wants and gridlock is likely priced in. If the Republicans can pull off a surprise we are likely to see fireworks tomorrow. We will cross that bridge if and when we come to it.

Monday, November 06, 2006

Friday's Jobs Report Changed the Outlook

Over the past week have been discussing the economic trend as compared to the trends in the stock market and the bond market. To recap, the bond market has been projecting a hard economic landing from the last round of interest rate hikes and its inverted yield curve has been projecting a coming recession. Contrarily, those buying stocks have been betting on a soft landing and more stable conditions. Economic data over the past couple of weeks has born out that the bond market was correct and that the stock market was not. On Friday, however, stocks received a boost from the jobs report, which may vindicate the position of stock buyers and show that it was in fact the bond market which had it all wrong. Friday's jobs report surprised the market (yet again) by adding jobs that had been missed in prior reports. The adjustments in this report over the past two months seem to indicate that the economy is growing much faster than other data has been showing over the past months. In other words, it now looks like the stock market was right; we are in for a soft, not hard economic landing. What this does is put the future rate hikes question back on the table, meaning that the blue chip sectors may once again become less attractive. On the other hand, it makes the more speculative small caps more attractive since they offer the potential to outperform the averages and create returns that offset the earnings erosion from rising rates. The stock market still needs to digest the news and could be quite volatile this week as it works through the implications. We should start to see some of the small caps produce good opportunities on the long side though and the impending strong leg down we had been looking for may now be off the table.

Friday, November 03, 2006

It's not the Data, but the Market's Reaction that Matters

Today the market awaits the monthly employment. The market's reaction to this report will be much more informative than the data in the report. Right now the bond market is predicting a recession and the stock market has been shaken, but not broken on fears that the bond market is correct. Since last Friday the market has received two important additions to current data that reveal the trend in the economy (not the market mind you) is rapidly in decline. Today's employment report will add more data to the mix. We will be taking the day off today, not adding any new trades. Today's market could be choppy and the close for the week will be a better measure to make decisions by than the potentially confusing first and second reactions to this morning's pre market report.

Thursday, November 02, 2006

Recession Watch Heats Up

More data hit the wires yesterday forcing the market to contemplate what the bond market has known for a long time now; that a recession is just around the corner. The yield curve has been inverted for over three months now and as noted on Monday, the data about US economic growth shows a clear downward trend that is quickly heading toward zero growth. Nevertheless, indices closed near support levels yesterday and it is quickly likely that the inevitable will be staved off a bit longer as recently converted bears, who have now been conditioned to buy the dips, help push indices back up as we near next week's elections. If the market does crawl back up the hill here, it will make for a good low risk short opportunity. In the meantime, focus on gold and consumer staples and avoid the broader market like the hot potato that it now is.

Wednesday, November 01, 2006

Can Microsoft Save the QQQQ?

This market is getting tougher and tougher to trade as the possibility of a breakdown increases incrementally each day this trend ages more. Even so, the trend is still higher and we are seeing stocks firm up even at these high levels. MSFT, which plays a large role in the performance of the QQQQ refuses to break down and is now projecting a breakout of a multi year trading range. This could certainly change the technical picture for the tech sector.

Tuesday, October 31, 2006

Probably a Top, But Tops Take Time to Form

The trend is showing signs of topping as money flow figures have been decreasing even as prices have remained flat. Tops take time to form since smart money sells into rallies slowly in order to avoid a panic before their positions are unraveled and they have been able to put on their shorts. It is very likely that this is the process that is occurring at current levels. Meanwhile, overly eager bears keep trying to short this market. We think they are too early. In fact, there are a number of stocks where bears have been pressing too hard, trying to break stocks down against the still in tact uptrend. This is a situation that is likely to lead to a series of false breakdowns and short squeezes that can be taken advantage of.

Monday, October 30, 2006

Economic Trend in Rapid Decline

The trend is your friend is pretty much the basic battle cry uttered under the breath in mantra-like repetition of any experienced trader. On Friday the market got a fair look at the economic trend that has been unfolding with the release of the GDP report. The government has done decent job of covering up the declining economy and has given the market the impression that a "soft landing" was in the cards. In fact, economic growth has been in rapid decline, indicating that the recession projected by the inverted yield curve may in fact be right around the corner and not later next year as had been originally projected. The stock market reacted to this information by selling off against the underlying uptrend in a fashion that we have not seen since this trend began last summer. That was probably the warning shot across the bow. Wall Street has been doing a good job keeping this rally going and it seems unlikely that they will let go of this agenda prior to the elections next week. Likewise, as we mentioned, mutual funds are scrambling to put their latent cash to work as they close out the books on their fiscal year. These two factors should keep the current trend alive. That is to say that last Friday's sharp decline should be met with a sharp contra rally back up to the latest highs. There are signs, however, that this rally has finally hit the wall that will turn it back. Money has been flowing out of the Dow, which is a very different technical development from what was occurring as this rally was underway last July. Likewise, the semiconductor sector, which is a leading indicator for the tech sector, is developing a head and shoulders pattern and has met with sharp distribution on each move up to the upper end of its trading range. The S&P still has good money flow, which may be due to the fact that mutual funds are busy putting their money to work. The trend in this sector could continue for a while, while tech starts to diverge through underperformance. We will be using today to look for stocks that are rallying weakly back up to broken support in order to start balancing out our open positions with some shorts in the weaker sectors.

Thursday, October 26, 2006

Top Callers Continue to Take on Haphazzard Shorts

We find it quite amazing that this bullish move has yet to reach the point of recognition where the bears finally capitulate and turn into longs. Shorts have been hitting this rally since the market bottomed back in July. We admit, we were skeptical and made our own mistakes trying to call a top up through September, to which we plead mea culpa. After the market showed that dip buyers continued to be as aggressive as we have seen in recent memory and once the small caps started to participate, we threw in our top calling towel and went with the flow. Thus far, it has been quite profitable to do so. Top calling persists in this market and shorts continue to attack the rallies. Yesterday QQQQ bears bought twice as many puts as they did calls. They may get lucky, but what we continue to find in this market are very nice buy set ups and a shear lack of distribution; just the opposite in fact, for every dip has found aggressive buying. It doesn't pay to throw caution to the wind here. The market remains technically overbought. At the same time, just because it is technically overbought does not mean that it cannot continue to climb higher. Strong market moves always go much further than most think probable or possible. We continue to warn against exuberance and at the same time warn about trying to call the top. Take the bullish set ups as they come and use stops to take you out when the market finally does turn. Gold is once again heating up, so pay attention to this sector.

Wednesday, October 25, 2006

Probabilities for a Correction Increase - But Don't Short Yet

Underperformance in the QQQQ compared to the SPY yesterday warns us that a correction is nearing. However, the QQQQ closed back at support and bears who shorted early are likely going to feel pain once again. The adage "be slow to go short" should prove true once again. One of these days – probably sooner than later – the top callers will be right. This market is feeding the top callers a great deal of pain though so it's best to just keep good stops on longs rather than going aggressively short here. One possibility we may see over the next two weeks is a tech sector that underperforms, but refuses to roll over, while the Dow and S&P continue to scratch out minor gains. We doubt that this market is heading for an exhaustion top here. Rather, it seems more likely that a healthy pullback will be the result of recent gains. The expected pullback would likely be a buying opportunity rather than a signal to go short. This is of course just one possibility out of many potential possibilities. For now, we remain in an uptrend, which is in tact until it is not.

Tuesday, October 24, 2006

Dip Buying Remains Strong

Bulls continue to relentlessly buy the dips as last week's dip back to support was followed by an explosive move back to the latest highs yesterday. What is most interesting here is the number of analysts who continue to doubt this market's move and the number of traders who continue to short the highs. In other words, this bull market has not yet reached the "point of recognition" where nervous retail longs finally realize that this is indeed a bull market and put money to work. They usually do so at the top, right before a correction. We have stopped trying to predict where this market may turn. Right now we strongly advice just taking what this market is giving – good long set ups – and leaving the top calling to those who are likely to continue fueling this move with their short covering. Protective stops should be used to take us out, not our human tendencies towards fearing the unknown. We read a great quote the other day: "if the market rewarded human nature, then nearly everyone would succeed." The wisdom behind that quote speaks volumes.

Monday, October 23, 2006

Trends are Bullish, but Extended

The QQQQ continues to look tired here. If it can make it back over $42.50 it is going to put a real hurt on a heavy institutional short position that is already hurting badly. However, if gets sold back down to $41.50 it will signal the beginning of a larger correction. The S&P and Dow both look much stronger, and while they are oversold and at risk for a pullback to their trend lines, dips remain buying opportunities. The end of the month should once again see a good rally take place. Since options expiration was last Friday, however, we could be in for some weakness as we start out the week this week. It is best not to get too aggressive until prices come back to better support levels.

Thursday, October 19, 2006

Dip Buyers Continue to be Relentless

The sector to watch today is the semiconductors, which we like to track via the SMH. It has pulled back harshly to its 50-day average. If the current trend stays in tact, we should see it bounce today, which would prop up the QQQQ. Money flow into the blue chips continues to be good and even the tech sector has been finding late day support. Remember, the amateurs trade in the morning and the pros show their cards into the close. Pros have been buying the close for the past two days. So again, we remind everyone, don't be too quick to become bearish. The market may be overbought and may be near resistance, but signs of distribution are hard to come by.

Wednesday, October 18, 2006

Waiting on the CPI Reaction

Yesterday's PPI numbers gave the market a shake, but by the end of the day the Dow and S&P had almost fully recovered as dip buyers remained aggressive. A crack in the market's armor showed, however, as the QQQQ and semiconductor sectors reacted more harshly to the higher than expected inflation numbers. Likewise, the tech sector failed to make the same strong recovery that the blue chips were able to carve out. We are still projecting the rally in the blue chip sector will stay in tact for the next couple of weeks (and perhaps up through the November 7 elections). Tech, while not likely to turn into a downtrend just yet, will probably start to lag as it did last spring. Today's CPI numbers, if as inflationary or more so than yesterday's PPI, have the potential to knock the QQQQ back to support near $41.

Tuesday, October 17, 2006

Be Slow to Become Bearish

We could be facing a "turnaround Tuesday" today as indices looked a bit tired yesterday. We need to warn traders to be slow to turn bearish however. Dip buyers have been as aggressive as we have seen in some time and there are no signs yet that this is about to change. Breadth remains good and our scans continue to reveal a bullish underlying picture. The tech sector looked especially tired yesterday, but bears were aggressively buying puts at rates nearing 5-1 over calls. With so many betting on a top here it is unlikely that a top is in just yet.

Monday, October 16, 2006

Charts are Great, but Protect Your Gains

We would like to make two points today. First, don't forget where the indices are. Those betting on a large upside breakout at these levels are betting on the greater fool theory; that there will be an even greater fool to buy at higher prices. Keep cool here even if (especially if) the market goes into a panicked buying mode. Second, just because resistance is overhead and indices are not likely to make much progress, trade what is in front of you. If set ups are good, take them and protect yourself with a good stop loss strategy. Right now set ups are very good. Yes prices may turn at any time, but no one made any progress in the market worrying about what "could" happen. You have to take the opportunities that the market gives you and protect yourself against the turns by using good risk management.

Friday, October 13, 2006

Next Friday's Expiration May Cause Shorts Pain

The interesting thing about this rally is that it was never trusted. Even now with the market breaking out to new highs, there remains a high level of distrust. With options expiration a week from today, that distrust, which has caused aggressive shorts to sell into the strength, is likely to keep prices moving higher. Why? Options expiration generally works against those who have the potential to feel the greatest amount of pain. Right now it is the aggressive shorts that are getting squeezed, so the pain from expiration is likely to be pressed against them.

Thursday, October 12, 2006

The Trend Remains Long Friendly

The bulls showed that they are still in control after a private plane crash in NYC caused a market scare. Volume on the recovery shows that bulls are still holding out for higher prices. As we stated yesterday, the trend is up until it is not. Right now it is up and it pays to stay long.

Wednesday, October 11, 2006

Keeping the Big Picture in Mind as the Market Climbs

We wish to keep today's report simple. We want to point out just a couple of points, that we think are important to keep in mind at this market juncture. First: the market remains in an uptrend until it's not. Until we have confirmation that the trend has broken, do not short dips or get scared and exit at dips. In other words, the long side is where the path of least resistance remains. The potential for a reversal is high, but the trend could possibly last until elections on November 7. Second: upside potential is small and downside potential is huge. Do not get carried away with the crowds buying breakouts at these levels. Breakout buyers at this stage are likely to end up as bag holders. On the chart below we have outlined where the QQQQ is at. As you can see, upside potential is muted, while downside risk is large.

Tuesday, October 10, 2006

No Update Today

There will be no report today due to traveling conflicts. Market conditions remain very much the same after Monday's session. There is no need to get agressive on the long side, but going short is probably premature at this stage.

Monday, October 09, 2006

Bulls in Control, but This is Their End Game

On Friday the market dipped, or rather the uptrend slowed, and options traders once again got bearish. No doubt about it, this bull run is in its end game here. Even so, as long as the crowds continue to get bearish on dips, the uptrend is likely to continue to chip away at their trading accounts by stopping out their short positions. The reason for this is relatively simple. The market rallies and the crowds get bullish. Short term profit takers sell the strength and the market dips. The crowd suffers a bi-polar-like mood swing and gets bearish, opening up large short positions as they attempt to pick the top. Subsequently, the trend (which is still up) reasserts itself and the new short positions add fuel to the rally as the crowds are forced to recover. This cycle will spin the market higher and higher and is the mechanics behind the phenomena oft referred to as "climbing the wall of worry." Eventually though, the crowd will learn the lesson and will begin BUYING the dips instead of selling them. When this happens, we can count on the fact that the top is either in place, or very close to being there. This week we wouldn't be surprised to see some consolidation or even pulling back. With the QQQQ and SPY both a few points away from overhead resistance, we would not count the uptrend over yet – especially with the crowds still selling the dips. Most likely longs will be tested this week and then the market will make another run higher before the uptrend finally starts to show signs of ending. Understand two things here and you will do well this month: First, this bull run is in its end game and downside risk far exceeds upside potential. Second, be slow to turn bearish, lest you find yourself being stopped out as prices refuse to follow through lower. In other words, wait for confirmation before going short, but don't be too aggressive on the long side.

Friday, October 06, 2006

Why Wednesday's Changed the Outlook

The Dow actually pushed above long term overhead resistance yesterday. Breakouts here are quite suspect, but momentum has the potential to push the market higher through the month, with a bit of backing and filling along the way. Risk increases now as momentum traders take over. For now we will try not to make any sweeping predictions and just ride the trend. As long as we continue to see decent set ups, it makes sense to stay long, using stop losses to protect against a price reversal. When this market comes down, it has the potential to come down fast. Until it does, however, this is no market to be short and long positions should continue to pay off. One brief comment about Wednesday's trading. Prior to the high volume, wide-range day on Wednesday, the market was at a pivotal point. Indices were at resistance. The market was likely to do one of two things that day; either break down or break out. Comments from the Fed helped it break out, which is why we were forced to shed our bearish posture. With the QQQQ breaking over its inflection point on Wednesday, odds seem pretty good that it will work its way back up to test last spring's highs. As it nears those highs, make sure to take profits into strength, but be slow to get bearish. This two month uptrend is at some point going to go through at a minimum a 50% correction. Until we get confirmation that the trend has rolled, however, over, it is a good idea not to sell the dips.

Thursday, October 05, 2006

Bulls Deliver a Potential Knockout Blow

On Monday the QQQQ broke down from the rising wedge pattern we have been concerned with. Then on Tuesday the price rallied back to test broken support (then resistance). We were waiting for confirmation in the form of a follow through lower from that test in order to trigger a reason to get heavily short. Yesterday the market voted and confirmation was not to be. Essentially what we have after yesterday is a failed breakdown in tech and a rally which occurred with broad scale buying. Failed breakdowns must be respected for they generally lead to hard rallies. Over the past two months we have provided a lot of reasons why the market should not rally. The market has disagreed for whatever reason. Some suggest that there is a concerted campaign to pump and rally the market into November's election season. We don't know. This explanation is certainly as good as any other because the obvious reasons for the rally just don't add up. Whatever the case, a few important things have changed since yesterday. Market breadth was good, as was new highs among individual stocks. Scans, which have been dismal for the past few days, have now turned up quite a number of bullish set ups. Likewise, the Russell 2000, which had been lagging blue chips badly, has moved up to test resistance and is threatening a breakout. Should small and mid caps take over, the ensuing rally could be strong. At times like this, it is important to just take your lumps and admit defeat. In other words, if you can't beat 'em, join 'em.

Wednesday, October 04, 2006

Is a Rising Dow Bullish?
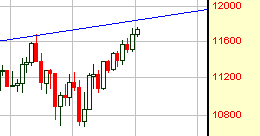
The media is cheering on the rising Dow as it pushed to yet another new all time high yesterday. Traders are hyping a rotation into the blue chips, arguing that we are entering a new era where blue chips will lead. We have to ask, these really bullish developments? By our readings, not really. The flight to blue chips is more indicative of institutional money that is getting nervous about the market. They have been moving out of the speculative small cap stocks (just check the Russell 2000 ETF IWM to see) and into the highly liquid blue chip sectors. This is what occurs at market tops not at market breakouts. And, since the Dow is leading let's take a close look at it. Below is the weekly Dow chart. Note that weekly resistance is at 11,840; just barely more than 100 points from yesterday's close. The Dow has been turned back at this rising resistance line each time for the past 2 1/2 years. Why should we expect this time to be different when tech lags and when speculative money is running for safe havens?

Note that the QQQQ accomplished the first leg (the up arrow) in the scenario provided yesterday. Now we wait to see if it will indeed be turned back at this area.

Tuesday, October 03, 2006

Bulls and Bears Likely to Be Frustrated this Week
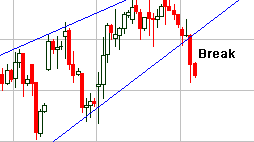
Today we have two slightly competing theses confronting the market. First, the QQQQ broke cleanly from its rising wedge pattern.

Second, too many traders have been waiting for this break and put options sales were through the roof yesterday as a result of the break. When too many people in the market are looking for the same thing, the perverse nature of the market is to deny the crowds their satisfaction. We scanned everything today and there are just not good chart set ups out there despite the QQQQ breakdown yesterday. Longs are very likely to be frustrated as rally attempts should now get turned back at resistance. Likewise, eager shorts are likely to be frustrated today as follow through from yesterday's breakdown is unlikely. Very often when a major breakdown occurs, the underside of support is tested before the trend can establish itself. Evidence points to a test of resistance that gives false courage to bulls and frustrates overly anticipatory bears before the market can move lower.
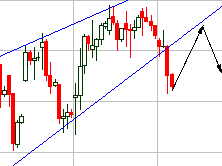
We highly recommend not forcing a trade here. When stocks are not setting up the best policy is to wait until they are. Let the other guys struggle against the trendless environment and save your cash to take advantage of the situation once the smoke clears.

Monday, October 02, 2006

Friday Was Probably Meaningless

On Friday it looked as if institutions had achieved the prices they wished to close the quarter out at for the day was locked in a tight range. Breakouts where confined as sell programs kept a lid on things and then when prices started to roll over, buy programs put in just enough bids to keep prices from moving lower. As such, it's hard for us to make much of Friday's action and suspect that what happens today will be much more meaningful as far as helping us to determine what to expect next. The rising wedges on all three major indices should be the driving force that favors sellers this month. Today we would expect sellers to gain control of the market, but with last week's mixed messages, we are not making any strong predictions here. The most curious aspect of Friday's market was trading at the option's desks. Nearly 10 call options were purchased for every put option on the OEX desk. This is certainly drastically overly bullish, but when you get numbers like this, there could be alternative explanations that are much more benign. We'll just have to wait and see how today plays out.

Friday, September 29, 2006

Sentiment Readings Near Dangerous Levels

Today is the last trading day of the quarter and it serves the interests of fund managers for this day to close near current levels for the purpose of their reporting to investors. Of course it's irrational to use benchmarks, such as new all time highs for the Dow, to measure real investment performance. Nevertheless, headlines attract investment dollars into the market and keep the investors happy. Interestingly enough, scans show very little that would attract us into buying this market. Most of the movement in the indices over the past few weeks has been accomplished by large companies, such as Microsoft and Oracle, doing most of the heavy lifting. In fact, it is into the large float blue chip stocks that most money has been flowing. If institutions are worried about a breakdown in the trend, the safest place they can put their money to work – and remember, they must put their money to work by quarter end as the requirements of most funds are that the managers be fully invested as the quarter expires – is into stocks that offer enough volume to allow them a quick and relatively painless retreat once things start to slide. Yesterday the market held its highs in what we would consider a consolidation pattern. Major indices – in particular the Dow and S&P – seem to be gearing up for a spike higher. It is our opinion that the spike higher will attract sellers, but today at least there is a better than even chance the blue chips will close out the quarter on a high note. Several sentiment readings put traders at over 90% bullish levels, the highest they have been since right before the 2001 market collapse. While the market may look good after today's session, unless you are daytrading this is certainly not the time to be going long the market.

Thursday, September 28, 2006

Selling Tech
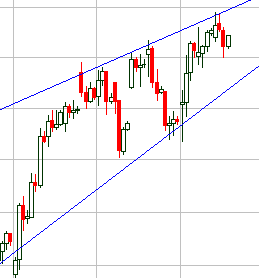
The Dow made a new high yesterday, causing the media to turn on their hype machine, which finally convinced the crowds to buy this rally as measured by the OEX options pit, which sold nearly 3 call options on the S&P 500 to every put. This is where smart money wants the crowds. Smart money has been unloading into this rally as we showed yesterday. With the crowds finally reaching levels of exuberance, now smart money is able to short heavily into the euphoria without creating too much of a panic. The blue chips may have another day or two or even three to rally or at least maintain their highs. The QQQQ on the other hand, has lagged and is now primed for a top. Note the rising wedge pattern that has confined this rally over recent weeks. Yesterday the price bounced off overhead resistance, but found weak late day buying. Today, now that the crowds have had a chance to go home and watch the news and read their journals, they may be in an early buying mood today. This could theoretically push the QQQQ up to or even above $41. There we would look for sellers to step in heavily. For the second week in a row the SMH has been rejected at $35. Yesterday's hard reversal and failure to bounce at the end of the day even as the broader market recovered somewhat, is the canary in the mine that has stopped singing. This sector is the leading indicator for the broader tech sector and this sector tells us that tech is weak. Tops take time to form, but while the blue chips are working out their top, we suspect that, like the last top in April the QQQQ will start to come down early.

Wednesday, September 27, 2006

Time for Caution

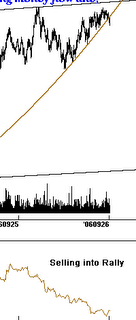
In August, right before the market began to rally, we ignored an important buy signal in lieu of chart and volume patterns, which indicated more downside. Because we ignored this signal, we were caught on the wrong side of the trade. Now, interestingly enough, we are getting the same signal, only this time in reverse. NASDAQ 100 emini Sell Signal: At the beginning of August, futures markets for the NASDAQ 100 emini contract showed a breakout in money flow, which preceded the breakout stocks. Now the same contract has a money flow indicator that reveals smart money selling into the current rally.

Also note the important break in the uptrend line yesterday, even as QQQQ shares traded higher. Adding insult to injury, the S&P 500 made a new 5-year high yesterday, while the NASDAQ lagged significantly. This type of bearish divergence has preceded each failed rally for several years now. Gaming Window Dressers: End of month window dressing has been increasingly gamed by traders who have learned the pattern. Not that long ago window dressing would result in rallies which took place during the last three days of the month, and sometimes extended into the first two trading days of the following month. Now, however, traders have been taking advantage of the rallies and selling into them during the later days, causing the rallies to start to fizzle during the last day or two of the month. If this pattern persists, it means that today should market the last day where window dressing is able to push the market higher. S&P Rising Wedge: One of the most bearish of all rally patterns is the rising wedge, a pattern we have highlighted several times over the past few weeks in the S&P 500 index. We have hypothesized that before this wedge gives way to selling, a strong upside breakout would occur in order to draw in bag holders. Yesterday we got the initial move of just such a breakout, as can be seen below.
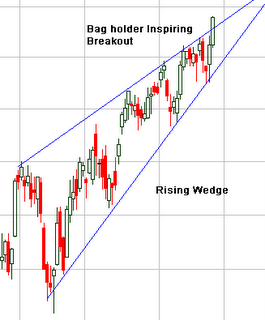
Window dressing may take this breakout up another day, perhaps two, but we argue that this breakout is very likely a bull trap, which will fail only to send the index tumbling back down to July lows during the month of October. Of course this last point is only speculation, but the rising wedge pattern is fairly predictable and given the divergence with the NASDAQ, the emini sell signal, and the fact that the 4-year Cycle low has not yet exerted its pressure, we think there are some pretty good reasons to take a seriously defensive posture starting this week. Once current buyers walk away and sellers are left without competition, this market can come down fast.

test

test

Time for Caution

In August, right before the market began to rally, we ignored an important buy signal in lieu of chart and volume patterns, which indicated more downside. Because we ignored this signal, we were caught on the wrong side of the trade. Now, interestingly enough, we are getting the same signal, only this time in reverse. NASDAQ 100 emini Sell Signal: At the beginning of August, futures markets for the NASDAQ 100 emini contract showed a breakout in money flow, which preceded the breakout stocks. Now the same contract has a money flow indicator that reveals smart money selling into the current rally.

Also note the important break in the uptrend line yesterday, even as QQQQ shares traded higher. Adding insult to injury, the S&P 500 made a new 5-year high yesterday, while the NASDAQ lagged significantly. This type of bearish divergence has preceded each failed rally for several years now. Gaming Window Dressers: End of month window dressing has been increasingly gamed by traders who have learned the pattern. Not that long ago window dressing would result in rallies which took place during the last three days of the month, and sometimes extended into the first two trading days of the following month. Now, however, traders have been taking advantage of the rallies and selling into them during the later days, causing the rallies to start to fizzle during the last day or two of the month. If this pattern persists, it means that today should market the last day where window dressing is able to push the market higher. S&P Rising Wedge: One of the most bearish of all rally patterns is the rising wedge, a pattern we have highlighted several times over the past few weeks in the S&P 500 index. We have hypothesized that before this wedge gives way to selling, a strong upside breakout would occur in order to draw in bag holders. Yesterday we got the initial move of just such a breakout, as can be seen below.
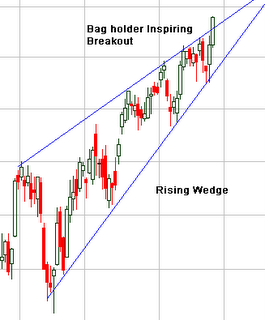
Window dressing may take this breakout up another day, perhaps two, but we argue that this breakout is very likely a bull trap, which will fail only to send the index tumbling back down to July lows during the month of October. Of course this last point is only speculation, but the rising wedge pattern is fairly predictable and given the divergence with the NASDAQ, the emini sell signal, and the fact that the 4-year Cycle low has not yet exerted its pressure, we think there are some pretty good reasons to take a seriously defensive posture starting this week. Once current buyers walk away and sellers are left without competition, this market can come down fast.

Tuesday, September 26, 2006

As Long as Everyone is Bearish, This Rise Will Continue

A few days ago we used the analogy of The Little Boy Who Cried Wolf in relation to the market's uptrend. We pointed out that as long as the market participants continue to try and time the top by buying puts into the rallies, the market would keep on climbing the wall of worry. Each time the market rallies higher, these shorts are required to cover their short positions at their stop loss points. Covering shorts drive the market ever higher. Eventually they will learn the market's lesson and stop shorting the rallies. When this finally occurs, the market, which has been crying wolf, will then reverse. The time is not yet considering that 2-1 puts were purchased against calls yesterday. This market could be headed for a blow off top this week, which will hopefully finally convince the bears to turn bullish. When they do, we can get the correction that we admit we have been way to anticipatory of. Much of the current strength can be explained by end of the month window dressing. Later in the week it is likely that this will be faded and we could see a quick reversal that at least does the job of shaking out the bulls. We are likely to see higher prices before that occurs though.

Monday, September 25, 2006

Window Dressing Should Prop Up Weak Market

With indices overbought and near extreme resistance levels it is getting too late to buy, bar for a few specific issues. Likewise, now that we are entering the last week of the month, fund window dressing (an illegal, but oft performed activity) should make life difficult for the shorts. As we move into October, the chances for a larger correction increase. The semiconductors have already likely seen their top as can be seen in the weekly view of the SMH below. Note the inability of this ETF to make it over resistance at $34 over the past four weeks. Each attempt has been met with stiff selling. Why is this index important? If you recall, it led the way up in this oversold rally that is now showing signs of aging. There remains potential for the S&P to test its highs this week. We will be surprised, but not completely shocked, if the QQQQ is able to also test its highs. We would use late week strength to look for short positions. Finally, for those feeling a twitch of concern at our market outlook, consider that after a corrective retracement, the probabilities for a strong late year rally are very good.

Friday, September 22, 2006

Market Cracks Some More

Profit taking yesterday and a continued divergence between big caps and the small caps and semiconductors shows that the cracks in this trend are increasing. We won't call it a top unless we see the S&P 500 break below 1310 though. Don't forget, we are nearing the end of the month where buying usually picks up.

Thursday, September 21, 2006

SMH Fails to Make a New High

The tech sector had in fact not made a top as yesterday provided. The market did prove to utilize the bear trap as we predicted it would. Longs have been extremely aggressive in this market. This does not mean that we are closer to a true break out than we are of a more serious correction. The first crack in the trend is the fact that the QQQQ made a new high, but the semiconductors (original leaders of this rally) did not confirm. The QQQQ is making new highs on the sudden enthusiasm in the old guard stocks ORCL, MSFT, and CSCO; all of which are extremely extended and nearing resistance

Wednesday, September 20, 2006

Monday's Scenario Still In Play

Yahoo sneezed yesterday, traders dumped their positions in panic, and the options market was stormed with orders for put contracts. What does it all mean? That the bear trap has been set and that the top is probably not yet in place. In order for this bear market rally to top the market first has to teach the crowd to lean the wrong way so that it can catch them in a "hold and hope" situation as their positions slowly erode. In order for the market to teach the crowd this perverse lesson, it has to cry wolf a few times (referring to the story of The Little Boy Who Cried Wolf). Yesterday, we believe, the market cried wolf yet again. If the market rallies higher from here, stopping bears out of their positions once again, they will likely have learned the lesson that the market is trying to teach: that is, if you short me again, I will burn you again. But alas, once that lesson is learned and the crowd learns to be afraid of the short trade, then the market will get what it wants: a downtrend with as few people on board as possible. In fact, this plays out well with the scenario we drew on Monday. The S&P has now pulled back near support. A reversal here and a new high would catch the most people unaware and the market always takes the path that catches the most people off guard. A push higher from here would very likely get a lot of people bullish and would allow smart money to make their final distributions. The crowd will then very likely hold those positions they bought here at the top all the way down to this summer's lows. If the market then takes out those lows, those who held and hoped from the top will very likely release their shares at much lower prices to the same smart money crowd who sold to them at the top. This is why we say that the market has a perverse nature. Bottom line: We will be eyeing carefully any strength as we enter the end of the month for shorting opportunities. And, should the four year cycle low take the market back down to this summer's lows, we will start looking carefully at weakness for good long opportunities. The tech sector remains weak here and may have already put in its top.

Tuesday, September 19, 2006

Buyers Still in Control/Tech May Have a Top

The QQQQ left a doji and the semiconductor sector tailed off at the top yesterday as profit takers nervous about giving up gains kept the tech sector from extending its gains. It looks unlikely that the tech sector indices will be able to mount any further gains from here without first correcting. The S&P and Dow are in sideways corrections, so the scenario we drew yesterday, which indicated a dip, then a rally, then a sell off, may actually skip the "dip" stage as oversold pressure is worked off in a sideways pattern. Nevertheless, there should be some good long and short side trades that last through the end of the month.

Monday, September 18, 2006

Support Test Coming Up
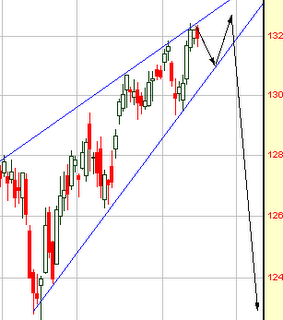
Friday's high volume gap up on the NASDAQ marked what is likely a near term top. Over the next few days we are likely to see indices work their way lower back to support levels. Currently the QQQQ has support at $39 and the SPY at $131. We will be operating under the thesis that the market will bounce from support as the crowd once again becomes too quickly bearish. The following bounce then should take early bears out of their positions as the S&P tests overhead resistance. From there, however, we should see the larger 4-year cycle reassert itself (see SPY chart below). On September 5 we outlined five reasons why we were expecting the market to return to this last summer's lows before it provides a true longer term buying opportunity. We were a bit early in our analysis at the time, but those reasons remain valid and by October they should assert themselves on the market. The QQQQ set up is a little more unclear as it has shown good relative strength lately. The bottom line: We are seeing some good long set ups at this time that should continue higher over the next couple of weeks. As we enter October the market becomes more vulnerable to a larger correction. Should the above scenario play out like it looks like it might, the return to the summer lows will provide an excellent long term buying opportunity. Participants are likely to be extremely bearish at that point and those who play it cautious as the market makes its top here will be in great shape to capitalize at very good prices indeed.

Friday, September 15, 2006

Watching and Waiting

Today is triple witching options expiration, which is accompanied by several economic reports that are being looked to with anticipation. We will withhold comments today and wait to see how the market responds. Remember, it is not important what the news is, but how the market responds to that news that is key. Take a breather today and don't open new positions.

Thursday, September 14, 2006

Pavlov's Lesson

Over the past 18 or so months the market has become increasingly less volatile as upside breakouts have been stymied by sell programs and downside breakdowns failed to gain momentum. This period of time has trained trades, including admittedly us, to distrust large market moves and to bet firmly against them. This "lesson" the market has been teaching is very much like the stimuli that Pavlov used to train his dogs. This pavlovian response caused a lot of people to distrust this rally and as such the rally scaled a wall of worry unlike one we have seen in quite some time. Up until yesterday, puts were purchased on every dip causing subsequent covering to drive the prices higher and higher. Even so, we need to be careful here as the market is very close to reaching that point of recognition which will cause the tables to turn. As mentioned yesterday, the rally on Tuesday quite likely pushed back the expected correction another couple of weeks. This is not the time to lose our heads. That said, the market internals have been quite good over the past couple of days as breadth has improved immensely and stocks making new highs continues to grow. There should be some long side plays as long as good trailing stops are used to protect against any downside. For the time being, we are going to abstain from any further predictions and stick with what is right in front of us. We are also going to try and take a bit more risk since being too conservative has kept us from participating in this rally. What is in front of us today are a few decent long side set ups. Will they follow through? It's likely, but who knows for how long?

Wednesday, September 13, 2006

Bulls Refuse to Give Up

After a weak rally built on poor volume and breadth, volume followed through yesterday and breadth turned utterly bullish as fund managers worried that they had missed the bottom for the year piled in. The head and shoulders pattern that the QQQQ had been putting together was denied after the index sliced through its 200-day average and closed at a new near term high. We continue to believe that the market is very vulnerable for a correction. However, yesterday's rally (based on dropping oil prices and speculation that the economy is due for a soft, rather than hard landing next year) very likely pushes back the expected correction toward the end of the month or even as late as early October. We are looking for the QQQQ to drift lower toward Friday's options expiration as options sellers "park the car" into maximum pain prices. Maximum pain for the QQQQ is $39 this month. The bottom line here is that you can't argue with the market. Has this rally been built on a poor foundation? Yes. Is it possible that yesterday's strong rally occurred based on spurious reasons? Yes. Can the market continue to rally higher than seems reasonable? Yes. Will it eventually correct and come back to build a better base? Yes.

Tuesday, September 12, 2006

Watching Tech's Head and Shoulders

We are doing our best to stay objective here and look for the bullish case to balance out our current bearish outlook. It's not easy to do however when even after two up days in a row now scans do not produce any long side set ups that don't scream "Risk!" The big story yesterday was the huge follow through lower in the commodities sectors. Oil stocks crashed through support levels on their double top patterns and the metals crushed their last line of support on heavy, heavy volume. This led to what could possibly be a rotation into the tech sector, but if so, it begs a question. If money that is rolling out of commodities is moving into tech, why did tech only experience a weak rally yesterday that was turned back at right shoulder resistance of the head and shoulders patterns we pointed out in yesterday's report? There is a huge amount of money leaving commodities and yet breadth was only slightly positive in the tech sector yesterday and it was negative in the blue chips (more stocks were down in the S&P than were up). All these negatives we keep harping about lately do not mean that the market cannot go up from here. They do probably mean that any upside move is likely to get knocked back down hard though. As mentioned, yesterday's upside move fits in well with the thesis that tech is trading in a head and shoulders formation. Any follow through higher today that sticks into the close would negate this hypothesis. What is very clear is the fact that things are just not real clear in the broader market and with options expiring Friday, it's difficult to trust this market. With so many unknowns, it's better to stay with open shorts and wait in cash with the rest of your money. Note: we would like to get short more commodities. If the sector can experience an oversold bounce here it will be worth looking for entry points. If it just keeps heading lower, we will likely have missed a speeding train lower.

Monday, September 11, 2006

Three Potential QQQQ Scenarios
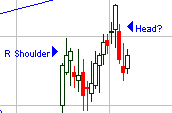
Options expire this week, but bulls and bears are fairly even, so hopefully undue volatility will be held to a minimum. On Friday the market bounced, but it looked to be more of a corrective move off of the overly bearish sentiment that was building since the market reversed last Wednesday. At this point, the QQQQ could be building one of two patterns: Head and Shoulders top (bearish)

If this is indeed the case, we should see the price bounce around between $38.00-$38.70 through options expiration, and then potentially break lower. Cup and Handle (bullish)
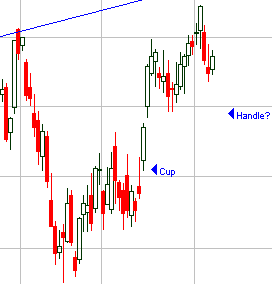
If, however, the QQQQ is forming a bullish cup and handle pattern, we might see the price move back to fill the gap at $37.70, only to reverse and then potentially break higher. The third scenario could be that the market is done pulling back and prices will follow through higher from Friday's rally. Technically this should not happen, but as we found out a few weeks ago, you can't apply logic to the market's actions; it sometimes just goes where it reasonably should not.

Friday, September 08, 2006

No Advantages to Forcing a Trade

With the S&P now breaking the lower support line on the bearish rising wedge pattern, the path of least resistance is now down. As we mentioned yesterday, however, there are too many bears out there to get much downside momentum started. We saw this play out yesterday as dip buyers stepped in, probably in response to ultra bearish sentiment, and kept a bottom under the market. The QQQQ tried to rally yesterday, but sold off in the late day, indicating that sellers are in charge, even though sentiment is giving some support. Drilling down to our scans, though, we find a very neutral near term picture. Reading the indices, we need to keep a bearish bias until we have a better reason not to. At the same time, we struggled to find anything that constituted anything close to a reliable trade set up on either the long or short side. When stocks are not setting up, it is always best to go to the sidelines and wait for better developments. There is no better way to lose money in the market than by forcing a trade. Days like today are best traded only by day traders. Days like today are usually short-lived and those who are patient and keep some cash on the sidelines waiting to act are quickly rewarded as better set ups emerge in their wake.

Thursday, September 07, 2006

Stay Patient, Sentiment Will Swing Again
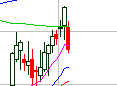
Yesterday the QQQQ (NASDAQ 100) left a strong sell signal as it failed at major resistance. On the chart below, the green line represents the 200-day average. On Tuesday the price closed strongly above this line, which we described yesterday as a temporary head-fake move designed to entice enthusiastic longs to buy more shares. Yesterday's gap back down and subsequent strong volume sell off confirmed our theory. The tech sector will probably bounce from yesterday's lows, but now any rally attempts are very likely to get stuck in the mud and prices will begin working their way lower; frustrating any hopeful longs who buy the dips. The SPY (S&P 500) moved down to support yesterday, but it has not yet provided a sell signal. Money flow perked up at the end of the day indicating that smart money has not yet determined that the rally is completely played out. There are just too many retail traders who have quickly jumped to the bear camp after yesterday's weakness. The market's perverse nature is likely to frustrate put option buyers by failing to provide immediate gratification. If the SPY can break below the blue uptrend line it closed at yesterday, it will signal a sell.
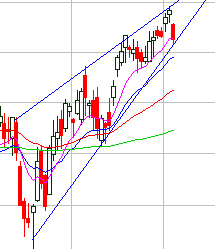
Right now we wouldn't be surprised to see the blue chips retest the highs. Should the S&P turn quickly around here and move back up to 1325, which we outlined yesterday as a magnet price for this index, those who turned bearish so quickly yesterday will very likely get bullish very quickly. The bottom line is that tops take a while to carve out. We expect to see some good shorting opportunities in tech over the next trading day or two. What we are going to be looking for is a bearish divergence between tech stocks and blue chips. If the S&P can indeed retest its highs, but the NASDAQ and semiconductors can only manage a weak bounce, we will aggressively short tech. If on the other hand the S&P is so weak that it can't hold support, there will be a number of breakdown plays, which should also provide shorting opportunities. Go long today if you are day trading, but don't look for any sustainable rallies to develop from here.

Wednesday, September 06, 2006

Be Careful Here

The S&P is just about back at formidable resistance (1325). This area will likely act like a magnet as bulls seek to drive prices higher, keeping bears off balanced. The QQQQ temporarily regained its 200-day average, but with the semiconductors still struggling, it is unlikely that this index will be able to surmount much more of a gain from here. This is especially true with the bond markets struggling. Right now it is best to sit on your hands if you have the urge to go long. The prospects for any meaningful price gains from here are poor. Shorts should start nibbling on positions as the S&P closes in on 1320-1325.

Tuesday, September 05, 2006

What September May Hold
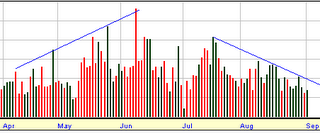
Today large money managers return from vacation in droves after spending the hot months of August in their vacation homes. Below we are listing our reasons for why we believe the institutions will unload their positions in September and why we believe that an excellent buying opportunity is coming later in the month. So, if you missed the latest rally out of distrust like we did, never fear, there will be a second and better chance to participate at perhaps even cheaper prices. Reasons we are looking for a decline from here: 1. During the last two weeks of August the market rallied, but on decreasing volume. The QQQQ rallied right into its broken 200-day average. Take a look at the volume patterns during the decline from April and the late summer rally. Note the increase in sellers on the way down and the decrease in buyers on the way back up.

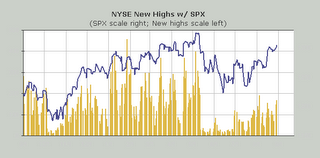
2. Likewise, the S&P 500 and Dow have rallied back to their April failure points. However, note the notable decrease in stocks making new highs during the latest rally (the yellow bars represent stocks making new highs, while the blue line represents the S&P price levels). This is a very strong bearish divergence, which makes a breakout to new highs very unlikely.
3. September has traditionally been the worst month of the year. This September the market is facing an additional seasonal factor, the reliable 4-year cycle. Longs have thus far done a great job at shaking out early shorts from their positions, which is generally what happens right before a large market move. 4. Overly bearishness has given way to overly bullishness. Last week Baron's magazine was cheering on the market as it approaches new highs. Money managers have a perfect opportunity to book profits into the crowd's enthusiasm. 5. Market volatility levels are back near all-time lows; another measure of the crowd's complacency as the market moves back up to test its highs. Bull markets climb walls of worry, and there is just not enough worry to move the market through the ceiling. Summary: Given the fact that the market has rallied for two weeks on low volume, that fewer and fewer stocks are making new highs even as the indices are nearing their highs, and now that the crowd is getting excited, it's a good time for the 4-year cycle to reassert itself. Outlook: Not all is bleak. Tech has shown some excellent relative strength and there are murmurings now that the Fed will once again start lowering rates to stave off an impending recession next year. The bond market has been behaving in such a way as to indicate this is true. September could be an ugly month for the bulls, but if the market is able to move back down to its June and July lows, we will be buying madly as this will mark a clear opportunity to take advantage of what is shaping up to be a strong rally in coming months. If you are worried about the market, make sure you are not mixing up your time frames. The outlook is pretty bearish directly ahead, but not so many weeks out in front, the outlook becomes much more bullish. Today: As we mentioned, the financial magazines and the crowds are fairly bullish after last week's strong close. The S&P looks like it wants to make a run back at its May highs. Meanwhile, money managers are going to come back looking to book profits made by their assistance and programs over the past few weeks. Early week enthusiasm then makes for a very nice opportunity to sell into strength. For the reasons we outlined in today's report, any further strength is not to be trusted.

Thursday, August 31, 2006

Watch the SMH for Signs of Profit Taking

The SMH is now firmly parked at resistance so we would expect to see profit taking start at any point. Other resistance areas pointed out in yesterday's report are also looming. Next week we will get a better picture of the market's near term intentions. Note: We plan to take off tomorrow for the holiday weekend. We wish everyone a nice and safe holiday.

Wednesday, August 30, 2006

Watch Out for Rising Wedges

The rising wedge pattern is one of the more reliable chart set ups as the contraction of price movement as prices rise reveal the fact that bulls are running out of fire power. Note the S&P 500 traded in a rising wedge pattern from the first of the year until April, when a breakout attempt proved to be a head fake and the price subsequently plunged into a two-week free fall, which gave back the entire gain from the previous five months.

Now take a look at the current S&P chart, represented below by the SPY (ETF) exchange traded fund.

The wedge here is in a much sharper uptrend, but the price is contracting nonetheless. Could the bulls rally the price of the SPY back up to $132? We don't know yet. But if they did, there would surely be a great deal of capitulation amongst the shorts. Likewise, given the low volume in which this steep climb has been driven with, the probable reversal could be sharp and swift. Now turn your attention to the QQQQ, which has been behaving a little better lately. Below we are providing a weekly view of this ETF. Note the red line on the chart just above $39. This represents the 50-week average. Note also the blue trend line drawn on the chart. This line represents the last broken uptrend. Stocks and indices often move back up to retest their broken trends before reversing. We don't know what exactly to expect next, but it is clear that any further rally from yesterday's close is sure to run head long into some serious resistance.

Finally, let's take a look at the semiconductor sector, represented below by the SMH ETF. The semiconductors actually look pretty good lately. They appear to be in a decent uptrend that is rising on decent volume. Also note, however, that yesterday's sharp move put the sector right near overhead resistance, as represented by the rising trend channel. Furthermore, $34.28 represents the broken 200-day average. Thus, any further rallies in this sector are also likely to run into heated resistance. The semi conductors could actually produce some good long side trades after a pull back if it is orderly. For now it is too late to try and catch this trend.

Bottom line: Professional traders are expected to return next Tuesday after the holiday weekend. Any breakout attempts following yesterday's strong close should be eyed very suspiciously. No one knows for sure what will develop next week, but several indices are poised for serious downside if the pros come back with selling on their minds. If, on the other hand, they come back in a buying mood, further upside is likely to be muted by serious overhead resistance. In other words, be extra cautious if you are trading the long side of this market and don't get too aggressively short unless we see some breakout failures start to emerge.

Tuesday, August 29, 2006

Bulls Need to Step Up as Time is Running Out

Tech indices appear to want to continue drifting higher as we move closer to the end of the month buying window. The blue chips, however, found serious resistance overhead as they tried to break out yesterday and once again the S&P and Dow sold off into the close; a bearish sign. The problems with this rally are pretty much the same problem all recent rallies have had lately. Volume is poor, breadth is poor, and there has been a disconnect between the indices. Blue chips have moved way out in front and tech, while making a decent catch-up move, continues to lag. Overall the technical picture isn't terrible, and is for the most part neutral except for a couple of reasons. First, while we are seeing some areas of tech make strong moves, reliable breakouts are not setting up in the sector. We are also seeing more reliable short set ups than reliable long set ups. Most significant, however, is the potential for the bond market to sell off later this week. Technically bonds are ripe for a sell off, which would likely put a nail in the coffin on the bullish case for stocks. Stocks can still improve and rally, but time is on the side of the bears here. The longer the bulls wait to put their technical pieces together the weaker their case becomes.

Monday, August 28, 2006

Don't Read Too Much Into This Week's Action

Look for volume this week to drop back to levels normally only incurred during the week leading up to the Christmas holiday as most of the remaining market participants take off for the beach. It's difficult, and probably unwise to try and cull too much meaning from last week's and now this week's activity. Last week was more representative of traders trading with other traders than it was of actual supply and demand. This week should be more of the same. With this in mind, look for both breakouts and breakdowns to fail. Bet against meaningful price action and look for stocks and indices to bounce between support and resistance. With volume levels low, it will be easier to manipulate prices and gun prices temporarily higher to take out the short's stop losses. Likewise, it will be easy to drop prices below support and take out the stops for longs. We plan to be very conservative this week, only trading where we can see a very clear advantage to do so. Next week promises a fair amount of fire works; though the jury is still out on whether there will be a market breakout or breakdown.

Friday, August 25, 2006

Slow and Boring Trading with Slightly Negative Bias

On the long list of indices we tract, relative strength readings yesterday were all negative, save for the SOXX, semiconductor index. We would read this as more of an anomaly than an indication that the semis are about to show leadership. No, this market is set to drift, with what looks to be a slightly negative bias, through next week. Unfortunately this lazy end-of-summer trading is not likely to lead to much excitement until after Labor Day. We don't recommend getting overly aggressive since what we are seeing now is more representative of small traders trading amongst themselves than it is of real supply and demand. Yesterday, once again, program trading caused a slight rally in the last 30 minutes of trading. One respected analyst indicates that this "propping up" of the market into the close is having only the effect of temporarily staving off the inevitable.

Thursday, August 24, 2006

Follow Through Lower is Doubtful; This Week Anyway

Sentiment has swung wildly back to overly bearish after yesterday's down day. Tech led the way lower but the semiconductor sector showed some resiliency, as did the S&P 500. Our scans today show a lot of bearish set ups and few reliable bull set ups. Nevertheless, we would expect to see the market bounce some today just due to the fact that bears are pushing too hard here. The reason that an overabundance of bearishness can cause the market to rally is not that complicated if you think about it. When the crowd is leaning one way, it means that they have committed their money. If the market fails to go lower due to the fact that all money that can be committed is already committed, bulls can gain confidence and cause short positions to start feeling pain. Once shorts start to get stopped out, their covering causes the market to move even higher. It's not really a question whether the market will deny shorts their sell off event this week. Shorts are likely to be disappointed if that is their hope. The real question is, is this market going to continue to experience serious distribution that quickly shuts down the rallies? If the 4-year cycle is going to take hold when the professionals return after Labor Day, then we should see more distribution and should see stocks struggle as indices near last week's highs.

Wednesday, August 23, 2006

Immediate Trend Nuetral

There isn't much to add to recent comments. Volume is low and the immediate trend is neutral. Bears are betting on an S&P breakdown, which could give it support, but bulls are betting on a QQQQ breakout, which should keep it below resistance.

Tuesday, August 22, 2006

Problems Remain with this Rally

Low volume, as predicted, has arrived. Yesterday was predictably a negative day, but selling never really took hold after an initial drop. We may see more backing and filling today and then could potentially see the market move back up near last week's highs later in the week. There are a number of reasons to distrust strength at this point. First of which is the fact that the bulls never experienced a capitulation event during the last downturn. Moreover, the market has rallied on below average volume. Most significant, however, is the fact that new highs have been sorely lacking. Stocks that rallied last week were weak stocks that rallied on short covering as shorts were squeezed. Significantly, stocks with strong charts trading near 52-week highs, failed to participate in the latest rally. Why is this important information? It means that smart money was willing to buy strength in expectation of the market making a strong bull run. The rally was then dominated only by short covering, which is indicative of a bear market rally, not the beginning of a new leg higher.

Monday, August 21, 2006

Let the Games Begin

Over the next couple of weeks volume should be very low as the pros head out for vacation. Last week's options expiration skews analysis and we will get some idea what real demand is this week, but emphasis should be placed on the word "some" since this week is certainly not going to clear up all questions. Real demand will not be known until the pros come back from vacation after Labor Day weekend. Look for games to occur in this low liquidity environment, with prices swinging widely against both bulls and bears.

Friday, August 18, 2006

Has Everything Suddenly Changed? Don't Bet on It.

All last spring and most of this summer, strength has been sold into. Early this week we had a similar situation, where the market had been trying to rally, but had been knocked back on each attempt. The market is often perverse though and once the pattern of selling strength was well recognized, it did the opposite of what it was projecting and gapped over resistance. Moreover, we have yet to see a real pullback in this trend. Readers will recall that we had a similar situation in May, only in reverse. In May, the market broke down from its long term trend and then traded straight down without one serious pullback. The QQQQ traded down $4.00 before it experienced a 50% retracement of the move. Now we have a mirror-opposite of May's down move and the QQQQ has traded up $3.50 from its lows, again without a pullback. Today is expiration day and a close near $39 on the QQQQ would cause the maximum amount of pain for the maximum number of options buyers as it would cause many of their put options to expire worthless; this after tremendous profits had been logged from the previous few weeks. Interestingly enough, $39 represents the QQQQ's 200-day average and a 50% retracement of the entire downtrend started back in May. In other words, there is some tremendous resistance at these levels. Getting back to lessons the market teaches us: the market taught us that it is good to sell strength, then, once the lesson was well learned, it perversely changed the rules. Do we now buy strength? We argue firmly, No! If the trend has changed, then we will see an orderly pullback from this major resistance level and dip buyers will be eager to get in. If the trend has not changed, we will see something of a panic ensue when dip buyers are not to be found. Today we should see the QQQQ trade near $39. A move slightly over $39 in the next few days is possible, but we would consider that a good opportunity to sell strength. A pullback from this area over the next few days to a week is about as sure a bet as bets go in the market. It is the character of the pullback that will be most telling.

Thursday, August 17, 2006

Watch Profit Taking for a Clue on What Comes Next

Yesterday bulls got the numbers they wanted on the CPI release, allowing them to follow through on the rally started from the PPI numbers the day before. We are still shaking our heads over the failure of the strong bearish signal, which we outlined earlier in the week. In all the years we have traded, it's the first time we have seen this type of failure. Had sentiment figures been overly bearish prior to Wednesday, we would have discounted the set up. They were not. Today we will not try and make any new predictions, but will take a wait-and-see approach. Profit taking should start very near current levels. All indices are approaching major resistance levels. The question is, how will the market react to resistance? Will it reverse with a vengeance? Will it consolidate as dip buyers come in? At this point it's anybody's guess. We will abstain from trading until we get some better answers. It would have been wonderful to have had a crystal ball and to have been buying the ugliness last week, but it doesn't take a crystal ball to see that buying or selling at current levels is risky indeed. Especially with options expiring tomorrow.

Wednesday, August 16, 2006

Bulls Get Their Revenge; Will it Last?

The market continues to be very hard to trade. The short set up we had on the QQQQ yesterday was about as good as they come; perhaps too good. Perhaps the signal was so clear that the only thing that a truly contrarian market could do was to fade the signal. Or, perhaps the lower than expected PPI numbers released before the market yesterday gave bulls an unexpected opportunity to exact some pain from the shorts. The later is the most likely explanation for yesterday's surprise rally. The QQQQ is in a bear market and this rally does not change this fact. It is possible that when the CPI numbers come out today that they will compliment yesterday's PPI release and give the bulls more ammunition to put the bears in pain. As bears cover their shorts, the QQQQ could rally back up to major resistance at $39. This is the reality of bear market rallies. They are quick and painful and they reverse just as quickly as the stopped out bears can slap their heads and say "Doh!" ala Homer Simpson. Alas, we cannot argue with the market, we can only react to it. Should the QQQQ rally up to $39, we will short it aggressively. Until then, it is important to keep position sizes small and trade discipline high.

Tuesday, August 15, 2006

Why are the Bulls so Confident?

Commentators are nearly all barking in unison pointing to relative strength and good breadth on yesterday's rally. Bulls are sure that bears are leaning too hard and that bears are ready to have their comeuppance served to them on a platter. Bulls in fact are so confident of this that they purchased nearly 2 1/2 call options for every put option on the QQQQ yesterday (remember, anything over 2 is overly bullish). We can't understand it. Yesterday we posted a chart of the QQQQ and pointed out how the price has tried to break the downtrend twice over the past several trading days. Yesterday marked a third high volume rejection in just the last seven days. The bottom line is, this market has been very volatile and as hard to trade as any market we have seen. As such, we would not add any more to the short side here, but we certainly would be very hesitant to go long and we would certainly hold current short positions open.

Monday, August 14, 2006

Indices Trading at Resistance

We start options expiration week with sentiment in neutral and with tech indices poised for another leg lower. There are several reasons we think that tech has more downside left in it before it finally carves out some meaningful support. First, the downtrend is still in tact and with prices trading right at resistance levels, sentiment figures, as mentioned above, do not reveal a great deal of concern. Should the crowd be overly bearish here, we might be more inclined to look for a breakout that surprises the crowd, but this just isn't the case. Second, our scans reveal an abundance of stocks trading in bear flags with technical indicators that are overbought. This has occurred due to the fact that the market has bounced softly in relief from the last down leg, which has put many stocks right up against their falling 50-day averages. Pros enter trades at the 50-day average. Finally, the QQQQ has made two recent attempts to break the downtrend, but was rejected on both attempts. Moreover, volume on the rejection days exceeded volume on the subsequent recovery days by a margin of nearly 2:1. Note the chart below. We have highlighted the rejection days and have drawn lines connecting the volume bars representing those rejection days. It is clear that distribution continues to exceed accumulation at this time. Understand that no one can possibly know what the market will do next. All we have to rely on are probabilities. It is important to short when it is scary to do so; when stocks are trading up against resistance and when you are afraid that resistance will be broken. Just like it is important to buy at support when everyone is worried and when your own emotions are telling you "don't do it, support might break." Why? Because it is at these times that probabilities are most strongly in your favor.

Friday, August 11, 2006

Yesterday's Rally Lacking

By now the market is trained to buy any weakness related to terror events. Despite the fact that the market is in a precarious position here, programs kicked in and bought the gap down yesterday and prices closed near daily highs. Wanting on the recovery was significant volume. Likewise, the move just pushed the indices up near resistance levels once again. We will be surprised if there is much follow through from yesterday's move. We would be much more trusting of a rally effort if the market would pull back down near recent lows to regroup and shore up support. We are not seeing any decent long set ups and short set ups look very good here. However, there is some concern that we will get a bit of an overly exuberant follow through rally, which while doomed from the start, could put our shorts in jeopardy of stopping out before the market reverses again. This is why we recommend keeping position sizes small in this market. Program trading has played havoc with position traders on both sides of the trade lately.

Thursday, August 10, 2006

Trend Reasserts Itself

Fears about the economy proved to be too much for the bulls yesterday. Their last attempt at breaking the market's downtrend failed and they are likely out of firepower to lift prices higher from here. This puts the lows from July into jeopardy. Don't fight the trend here. Now is the time to be short this market.

Wednesday, August 09, 2006

Traders Sell the News

The pause in rate hikes sparked a very minor rally before prices took a sharp plunge. This shows that the downtrend is firmly in control and that lower prices are to be had before we get a significant bottom. Nevertheless, QQQQ bears are a little over confident and are leaning too hard one way. The put/options ratio shows that we should get something of a bounce today. The day after the Fed meeting, stocks generally reverse much of the previous day's activity, so it is likely that today will see some price relief from yesterday's sharp move lower. Since the downtrend is still in effect, today's expected strength should help set up better entry points for taking on new short positions. Most stocks remain technically overbought and any strength should be used to open new shorts.

Tuesday, August 08, 2006

Looking to Fade a Potential Fed Rally

Today the Fed is likely to take a pause on rate hikes. The market expects this, but such an event should spark a quick rally nevertheless. Unfortunately a pause at this stage is not going to clear up the worries that this market has in front of it. A pause this time does not take away the question about whether or not the Fed will choose to pause next month. As such, any quick rally after the release – or prior to the release in anticipation – is likely to be quickly sold. Indices and stocks alike are now technically overbought and rallies are generally sold when this is the case. Due to this long string of rate hikes, there are strong indicators pointing to a recession next year and the market knows this. The only scenario that might spark a legitimate rally would be an actual lowering of rates this round as it would indicate that the Fed is concerned with the health of the economy and the market. From what we can gather, however, it appears that the Fed is more interested in fighting inflation in the commodities sectors than it is in the current stock market outlook. This is why, we believe, stocks are projecting more downside.

Monday, August 07, 2006

Fed Meeting Looms Large

On Friday all major indices gapped up and then sold off the remainder of the day. Late in the day buyers started to come back in, but this could have been daytraders taking profit on their short positions. This sets up an interesting situation. The tech sector is overbought and has now sold off at resistance. There has been no evidence of accumulation and ideally, this is a perfect short set up. The problem is, tomorrow the Fed meets and tomorrow's meeting is perhaps one of the most important events the market has had to look forward to in some time. The yield curve on long term bond rates has now firmly inverted, threatening a recession late next year. This puts some pressure on the Fed to pause. The question is, is the Fed interested in avoiding a recession, or do they have something else in mind, such as putting the brakes on the world economy to get oil prices back into line? If the Fed takes a pause tomorrow, as it is expected, then the oversold condition of the indices is likely to move up to even more oversold as prices rally in celebration. We will probably short such a rally, but will need to see what the charts look like after the dust settles. If the Fed raises rates again, it would probably be very bad for stocks and we could see a sharp down day, for as we mentioned, stocks are ripe for a slide already.

Friday, August 04, 2006

Jobs Data Will Lead the Way Today

The market rallied back to resistance yesterday on a bet that today's jobs data will be weak enough to render the Fed with no alternative but to stop their rate hikes during next week's meeting. The problem is, market leading indices, including the QQQQ and SMH, were pulled along for the rally as opposed to having led the way. Accumulation indicators on these two indices have stayed flat even as the price has moved higher, indicating that smart money has not participated in the rally. There is a potential that the jobs data will propel indices higher today, perhaps even pushing them over resistance. We hope that this will not occur however. Capitulation, which is needed to mark a clear market bottom, is strikingly absent and any rally higher from current levels will be performed on very little buying fuel setting the market up for another extreme wave lower. It would be much better if indices turned back here and worked on building a base of support before they rally above downtrend resistance. We can't tell the market to do what we want it to do though so for today, we will wait and see what develops after the jobs report to be delivered before the market opens.

Thursday, August 03, 2006

QQQQ Should Test Resistance

The tech-heavy NASDAQ continues to diverge from the blue chip S&P 500 and Dow indices. Until tech starts to lead the way, any move higher in the blue chip sector should be viewed with suspicion. We are operating under the theory that the NASDAQ, which has been the market leader on all rallies over the last few years, maintains its leadership role. As long as this leader is diverging bearishly against other sectors, the downtrend must be respected and strength must be faded (sold into). There is some evidence of accumulation in the small chip indices indicating we are in the middle of a basing cycle and not a distributive one. Nevertheless, it appears quite likely at this time that we will see the QQQQ head back down to its lows at least once more before it finds enough strength to make a break of its immediate downtrend. We do expect to see buyers continue to buy over the next few days lifting indices slightly higher. We suspect, however, that smart money will be using this as an opportunity to reload their short positions. Look for the QQQQ to test $37.40-$37.60 over the next day or two.

Wednesday, August 02, 2006

Bear Trap Being Set, or the Real Thing?

The QQQQ gapped down and led lower yesterday after a low volume rally up near resistance. The question is, is this a bear trap in the making? QQQQ shorts are buying 4 times as many puts as bulls are buying calls. With bears leaning one way so hard it seems unlikely that yesterday's sell off will gain much follow through momentum. Likewise, yesterday's gap lower is probably more bullish than bearish at this stage. Bears are getting overly exuberant while weekly charts are very oversold and due for some relief. It wouldn't take much to spark a strong relief rally and with the Fed possibly acting next week, this may be the spark that bulls are waiting for to challenge this latest sell off. It might be a better idea to start thinking about buying weakness as opposed to selling it.