Securities Research Services

Wednesday, July 30, 2008

Keep An Eye On Oil

We are seeing strength this week which can most likely be explained best by end of the month mark ups. This market remains very unpredictable at current levels.

Today oil saw volume and USO may have turned the corner. It is projecting some type of bounce here. If recent oil trading history can be a guide buyers may move back into this sector aggressively.

If this does happen recent strength in the broader market is questionable. We recommend keeping very short time frames on your trades here and be very impatient if trades don’t do what you expect them to do. It’s better to bail out of bad trades early than hold and hope as prices get chopped up again.

Monday, July 28, 2008

Cash Is King

This tough market has gotten even tougher over the past week. Prices bounced out of oversold conditions starting on the 15th of the month. The bounce quickly turned oversold conditions into overbought conditions and now we are once again trading very close to the lower Bollinger Band on all major indices.

So, what does it all mean?

The theory behind the risk assessor is that in a down trending market short side risk is relatively low when prices are trading near the 50-week average and downtrend line. This low risk situation occurred mid May. Likewise, short side risk increases as the price closes in on the lower Bollinger Band. As you can see below, the current SPY price is only $2.00 away from the lower B-Band.

So then, is it reasonable to assume that because short risk is high here that long side risk has decreased? It is very dangerous to make that assumption in a down trending market. Prices are oversold on a weekly basis as measured by the Risk Assessor. Oversold conditions can remain that way in down trending markets though.

With the end of the month window dressing closing in fast and with short side risk levels very high due to the position of price in relation to the weekly B-Band we would recommend avoiding new short positions at current levels. Unfortunately, there are not a lot of promising set ups on the long side developing here either.

Perhaps tomorrow will provide us with a turnaround Tuesday event and will set up some quick long side trades as we move in to the end of the month period. Until the market proves itself here though it’s best to sit on cash another day because this is one very dangerous market.

Thursday, July 24, 2008

Getting Overbought

The market is getting overbought here. Near term stochastics have reached overbought status. In a strong uptrend this condition can persist for some time. However, given the fact that this is nothing more than a bear market rally it is very likely that the overbought reading marks the turning point for a pullback.

We would look for SPY to pull back to the $124-$125 area before putting on any more long positions.

Wednesday, July 23, 2008

Time To Get Long

Yesterday we outlined two possible scenarios. Both assumed that the near term path of least resistance was down. Alas the difficulty of predicting the market's future. The market made a dip in the morning, but then buyers, who had been holding their cards close to their chests, showed their true intentions and bought, and bought and bought, closing out the day with a huge gain on volume.

Moreover, breadth on the day was excellent as was the price/volume relationship, which was the most bullish of all possible relationships; price up, volume up.

It looks like our bear market rally is off and running. It's time to get long. Just remember to take quick profits. The longer term trend remains down and once this rally plays out more downside is sure to come.

Tuesday, July 22, 2008

Indecision Indicates Volatility Ahead

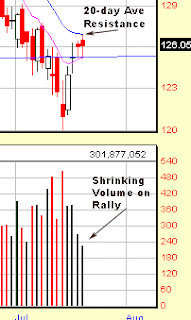
The SPY has rallied into its 20-day average where it has stopped cold over the past two days. Volume has shrunk into the rally and yesterday's meager volume indicates indecision.

Today's scans confirm indecision as good trade set ups are difficult to find and those that do exist look unreliable to us.

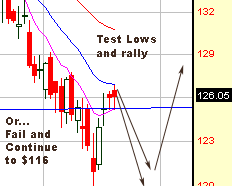
In lieu of this situation we have outlined a couple of potential scenarios that could unfold next.

Given shrinking volume into resistance it appears that the near term path of least resistance is back toward last week's lows. Prices certainly could surprise and rally higher here, but probabilities just don’t favor this due to shrinking volume and mixed sentiment readings.

Scenario 1: The first possible scenario to look for would be a decline back to last weeks lows where support at those levels fail and prices continue lower to the $116 target we outlined last week.

Scenario 2: The second potential scenario to watch for would be a low volume retest of the lows, or even the development of a higher low, which then rallies back up again, this time over the falling 20-day average kicking off a bear market rally that could last 6-8 weeks.

Because of the lack of clarity at these levels and the high level of risk, we would recommend either a cash position here, or, if you must, a hedged position where you are equally long the strongest stocks and short the weakest stocks; keeping relatively tight stops on both. In our opinion, cash is the better position until better set ups develop once again; which is likely to occur later this week.

Friday, July 18, 2008

Near Term Momentum Reverses

There was no capitulation and fear levels did not reach anywhere near what should be expected for a significant bottom in this downtrend. Nevertheless, the market is seeing reversals out of its vastly oversold condition. Oil breaking its trend has certainly helped matters.

The SPY has not followed through significantly and has merely moved from a neutral trend to a sideways trend. But the Dow and NASDAQ have clearly reversed momentum from down to up.

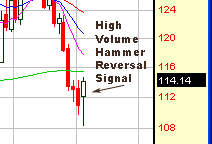
Dow experiences a Hammer reversal on its weekly chart.

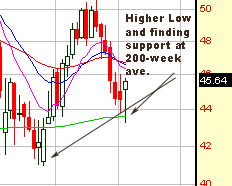
The QQQQ has put in a higher low and found support at its 200-day average.

Given the fact that we have not yet experienced capitulation we suspect that another downswing may be ahead where last week's lows are retested and will perhaps give way to lower prices. Before that occurs however, it is important to recognize the fact that near term momentum has changed and that a tradable rally is underway. Profits will need to be taken quickly, but there should be profits to be had on the long side for a week or more.

Note: While the near term trend for the SPY is still neutral, the trend has turned back up on both the NASDAQ and Dow. It is likely that SPY will follow and turn higher as well. We seriously doubt this is the end of the bear market, but a tradable rally appears to be developing within the primary downtrend.

Thursday, July 17, 2008

Tradable Rally Developing?

Buyers clearly took control of the tape yesterday as oil followed through lower. Now the big question is, is this the start of a tradable rally or just another big up day destined to get faded like the big up days on July 1 and July 8?

The answer to that question very likely rests with oil. USO pulled back to its rising trend and tagged its 50-day average yesterday. If oil follows through lower, we suspect that buyers will remain in control of the market for a few more days. If not, then this rally is likely to get faded very quickly.

Also keep in mind that we are in the middle of peak earnings season. The market is likely to move based on guidance of the major companies that make the headlines. Today a whole slew of companies report.

The bottom line is we need a follow through day before we can start to think about recommending long positions in this market. A follow through day lower for USO and a follow through day higher for the SPY would go a long way toward giving this market better set ups on the long side.

That said, keep in mind that this market is in a primary downtrend. Sentiment readings are no where near extreme levels that mark bottoms. Any trades to the upside must be quickly sold into because the likelihood of another stab lower after a brief rally is very likely. SPY $116 remains in play. In our opinion the strongest play in this market is to wait for the market to bounce a bit and then start looking for failures to short once again.

Tuesday, July 15, 2008

SPY Target $116

Sentiment readings are confounding here. The SPY has broken weekly support, the banks are failing, stocks are getting decimated on heavy volume, yet near term sentiment remains oddly stuck in neutral.

With so many thinking this market is oversold and due for a bounce, said bounce is very unlikely to occur unless the news improves. The Fed bailing out Fannie Mae certainly didn't do it.

From where we sit, the SPY is headed to the $116-$117 area before it offers even the hint of a chance for a tradable bounce. With that in mind, here's a scenario to look out for over the next few weeks.

Taking a look at the monthly SPY chart, note that the multi year uptrend currently resides at roughly SPY $116. The horizontal line just below the multi year uptrend (roughly $113) represents a 50% Fibonacci retracement for the bull trend which began in 2002 and ended late last year. And, the lower channel of the current downtrend meets squarely in the area between $113-$116 as well.

This offers us a pretty good target for this latest leg down. Assuming near term sentiment spikes to overly bearish levels when the SPY reaches this inflection point we should see a pretty good rally ensue from that level, offering a good spot to cover shorts and to start thinking about getting long again for a bounce.
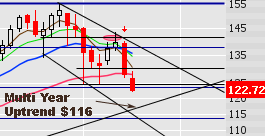
Probabilities look fairly promising that we will see SPY $116 over the next few weeks. And probabilities appear to be fairly promising that at that point a multi week tradable rally to the upside will ensue.

Longer term things are not quite so clear. We hesitate to guess where this market is going after that. However, if one were to make the assumption that we are in a bear market that is similar in breadth and depth to the 2000-2002 bear market then an ultimate retracement all the way back to SPY $72 is not unthinkable.

There is a lot of noise out there arguing that this bear market is nearing its end and that bear markets typically don't give back much more than this current bear market has already given. That may be true, but perhaps this bear market is indeed a bear market like the one that followed the tech bubble. We are after all faced with a situation in the credit markets that we have not previously experienced. Given this fact, it seems reasonable to us to toy with the assumption that this bear market is not a typical bear market.

From a traders perspective we will say that this situation is vastly preferable to the low volatility, thin breadth market environment that was exemplified in the last half of 2006 and all of 2007.

During that low volatility environment, options sellers ruled the roost while traders struggled. Now that we are back in a situation where massive inefficiencies exist new opportunities are springing up that we can now exploit.

Just as an example, in 2003-2005 it was not unheard of to see stocks run up 100-200% in just a matter of days. These opportunities dried up over the last few years, but with this market correction those types of opportunities are sure to return once again.
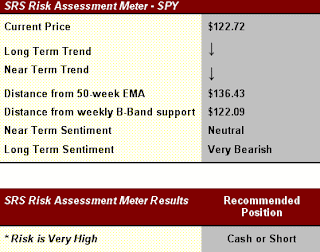
Note: The B-Band continues to spread and the 50-week average continues to drop. This is a strong bear market and there is no reason to buy anything but gold and silver despite the fact that this market is technically oversold.

Monday, July 14, 2008

Market Vulnerable For A Crash

The market continues to stare down the brink of the abyss here. Yes it's oversold. No it doesn't have to bounce.

Here's the problem. While the SPY took out weekly support at $125 on a closing basis last week near term sentiment levels have remained stuck at neutral. The VIX, at $27, is roughly 8 points away from the levels it spiked to before the last two market turning points. And, adding insult to injury, options traders continue to buy calls during every short lived rally.

This is a market that is clearly sliding down a slope of hope. While it could and probably should bounce here, we are thinking that just the opposite is going to happen. This market is what markets look like before they crash.

Friday, July 11, 2008

Market May Be Headed For A Washout

Volume increased yesterday but price is problematic here. The SPY is testing $125 support hard and unless it can bounce significantly higher today it will close out the week with a strong sell signal on the weekly chart.

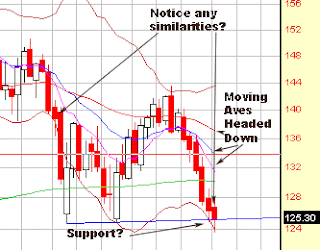
On the weekly chart view notice the development of a couple of troubling developments. First, note the spreading of the Bollinger Band, quite similar to the same sell signal that occurred at the first of the year when support at $140 was demolished. Over the past few weeks, since the price fell from $143, volume has picked up significantly indicating that it is highly unlikely that $125 will hold here.

Next notice the fact that the 50- the 20- and the 10-week average have all turned down. This indicates a strong downtrend in effect. We suspect that when $125 support finally gives way that the market will wash lower the same way it did in early January.

Note: The B-Band is spreading out and while the price tagged the lower band yesterday, the spread indicates that volatility is growing offering a sell signal. It is unlikely that $125 support will hold if the price closes the week without a significant bounce today.
:
:


Just add your name and email to the form above to receive free short picks to take advantage of the strong likelyhood of an upcoming wash lower.

Monday, July 07, 2008

Two Possible Ways Stocks Can Fool The Crowd

There is a wide consensus that stocks are oversold and chatter is getting loud in expectation of an oversold rally to form from current areas. If you read our last report you will note that we were also expecting this.

There are reasons developing that are developing to be dubious about this proposition. It's good to be highly suspicious when the majority of commentators are all looking for the same scenario to unravel. Aside from this, there are some compelling reasons to consider that stocks might just not be a good buy at current levels.

Fear levels have remained at a constant neutral position even as prices for the SPY have been retesting that all important $125 level we have been discussing in recent reports. A good way to quantify this is to check out the strong divergence between the VIX (fear index) and the price of the SPY.

A quick scan of the VIX reveals that in January and again in March, when the SPY tested $125, the VIX spiked up past $35. This means that during those two tests fear levels revealed a crowd that was in panic mode offering buyers a great contrarian reason to buy aggressively.

But now we see SPY back at $125/$126 and the VIX is only trading at $25, a very strong negative divergence. Moreover, volume levels hardly show that contrarians are buying at current levels. Without volume and without fear it is hard to imagine that stocks can put together a sustainable rally from current levels. Moreover, oil is a whopping 35% higher now than it was back in March, which makes it all the more likely that SPY $125 is destined to move from its position of support to a position of resistance.

So, since the crowd is looking for a bounce here, let's consider two other possibilities that just might unfold next.

Possibility #1

The first possibility is that buyers at $125 will get quickly burned as prices fail to bounce at all. Those recent buyers should be considered weak handed players and when their stops are hit a waterfall-type decline could potentially ensue; or something like a mini crash.

Possibility #2

Prices bounce weakly but quickly fail at the falling 20-day average leading to an eventual break of $125.

Either way, the market should be looked at with a high degree of skepticism at this point. Even metals and energy are getting crushed here leaving no safe harbors on the long side of the tape.
:
:

Tuesday, July 01, 2008

Oversold Conditions Do Not Favor Johnny-Come-Lately Short Positions

If you shorted back when the risk assessor triggered a strong sell signal when the SPY was in the $141-$142 area, continue to hold. However, if you are looking for new short set ups here, save yourself a great deal of pain and be patient for the upcoming bounce before adding any more money to the short side.

As can be seen in the daily SPY chart, the price is now trading outside of its down trending channel. This is indicative of an oversold condition. While conditions can remain oversold, the most likely scenario is that we are very near a bounce, which should squeeze late comer shorts.

We wouldn't even consider putting on new short positions until at a minimum the price bounces back up to the falling 20-day average, now at $132.88. When the bounce does come, it will need to be assessed for volume and price action before new shorts can be considered.

Juxtapose the 50-week average and B Band price today against recent reports. You will notice that the 50-week is turning lower and the lower B Band is spreading out to lower prices. This is a strong weekly sell signal. Again though, this market is due for some type of bounce before prices head significantly lower.