Securities Research Services

Tuesday, January 31, 2006

Important Day Today

The market is expected to analyze and digest the outcome of three major issues over the next two days. This afternoon of course the Fed will raise rates and will issue their statement. This will likely be the biggest market mover. Watch for a quick reaction after the report, which is highly likely to get faded. In other words, if the market dumps after the report, buyers are very likely to step in at the opportunity. Likewise, if the market takes off, sellers are very likely to use it as an opportunity to take profits. Ultimately, we are not likely to get much of a trend going today, though the swings could be violent. After the market Bush will give his annual State of the Union address and Google will report. Taken together, these three events are likely to set the tone for the rest of the week and perhaps the next few weeks.

Friday, January 27, 2006

New Round of Earnings Today

Today the market will be required to digest the largest group of earnings reports of this earnings season. Technically the market is set up for a short squeeze but today's reports have the potential to either embolden new bears or crush short positions. It's really up in the air at this point.

Thursday, January 26, 2006

Potential Short Squeeze Setting Up

From the year 2004 volatility and breadth levels noticeably declined from prior readings. This makes sense since the market up until November of 2005 was in a fairly tight trading range. During this trading range whenever indices threatened to break out, breadth would decline, good trade set ups were difficult to find, and ultimately the subsequent failed breakout would grind hopeful longs into submission as supports failed to hold. Early this month the major indices broke out above resistance and breadth and volume were strong this time. Last Friday however the breakouts failed on a high volume crash day. What hasn't happened yet though is a decrease in market breadth. Small caps are still performing quite nicely and set ups are looking more and more promising. There is some selling pressure, but sellers are far from being in control of this market. This week we are faced with major indices consolidating last Friday's sell off. Theoretically this consolidation period should favor the shorts as they build their short positions and attack each rally attempt. The problem for the shorts right now is that the indices are not only extremely oversold, but breadth figures are pretty good. This means that there are a whole lot of stocks that are not breaking down with the indices and leadership has been changing. To make matters even more difficult for shorts is the fact that we are moving into the end of the month buying window. The market could break down further here, but the probabilities stacked against this are formidable. Aggressive shorts putting on positions in hope of a support break here are going to be forced to cover when the market bounces to relieve some of the oversold pressure. Likewise, when fund money comes in at the end of the month there is a potential for a very strong bull-inspiring short squeeze.

Wednesday, January 25, 2006

Was Friday Just a Really Good Headfake?

We are getting some very strange mixed signals this week. Major indices, including the NASDAQ, Dow, and S&P 500 are setting up classic bear flag scenarios. Strength over the past two days has been nothing short of a dead cat bounce. These indices scream to be shorted. At the same time the small cap indices such as Russell 2000 have broken out into new all time highs. Adding to the puzzling information is the fact that scans continue to turn up very bullish set ups. Last week before the market crash we commented that the market was providing the best set ups we had seen in years. After Friday's crash this has not changed. In fact, the few short setups we are finding are failing to follow through. A great example of this is THC, a stock which showed up as an excellent breakdown set up before yesterday's market open. THC did in fact break down yesterday, but only to be scooped up by bottom fishers. Rather than evoking panic, the breakdown triggered a signal for money to come of the sidelines in a bargain hunt. What to make of this? We frankly don't know. The market appears to be setting up for a big move and the perfect short set up on the major indices might just be "too perfect." Either shorts are going to get burned yet again, or the small caps are in for a major correction as the divergence is ironed out. Underlying strength in individual stocks seems to predict that shorts are going to get burned.

Tuesday, January 24, 2006

Trends and Timeframes

As most of you are aware the stock market has many different trends occurring simultaneously. Which direction the market is trending depends on the time frame you are analyzing. This is always an important distinction to make and it is particularly important to have a big picture view but equally important to know your time frame. After Friday's crash we have to operate under the assumption that the immediate daily trend is down keeping in mind that the weekly trend remains up. This is easier to understand visually, so we are providing a couple of different chart views analyzing the QQQQ. Note that the daily price on the QQQQ found overhead resistance at $43. After pulling back from this level there was some chance that resistance would be broken through on a second attempt. On Friday this attempt failed however and an immediate downtrend was established. There is some support below Friday's low, but it is unreliable as a trading level. The trend is our friend and the short term trend is now down. Current support will likely provide an area where the indices will weakly bounce in a counter trend move. This counter trend move should set up a nice short entry.

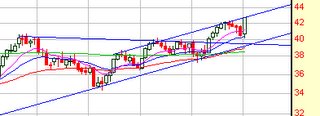
For those concerned that a bearish trend means a bearish market, fears of this sort are unfounded at this time. The weekly trend remains up as you can see from the QQQQ's weekly chart. Bears have very likely targeted the open gap at $39.50 and now that they have a trend in their favor they are going to be fairly aggressive about getting their target. A move back to this level would set up a wonderful buying opportunity in the longer term up trend.

The bottom line is that long positions in the general market are going to struggle near term but long term positions should be in good shape for the foreseeable future. Also keep in mind that bull markets in oil and precious metals are still in tact and still strong.

Monday, January 23, 2006

Friday's Crash Catches Us Offguard

The markets opened fairly flat on Friday, then proceeded to collapse as the biggest crash bar since last summer formed on the daily charts. Some are arguing that Friday can be attributed to expiration games by those who had been selling $41 call options on the QQQQ. Since the NASDAQ 100 was hardest hit we will say it is an interesting theory. However, Friday's crash puts a huge monkey wrench into our overall analysis as it calls into question the viability of the breakout, which occurred in November. Subscribers may recall that on October 19 the market experienced a high volume reversal day, which we determined at the time to be a strong confirmation of support. From that point the market has experienced a strong rally. Friday's high volume reversal day must then be taken seriously as it could be marketing a line of overhead resistance. Does this mean that we are heading into a bear market? Not at all. What it means is that unless we see an equally strong reverse of Friday's sell off this week that we will need to be using the oversold bounces to sell into. The immediate trend remains down after Friday and until that trend reverses, long positions are going to struggle. How this all fits into the longer term outlook of the market, we just don't know right now. Today we expect to see at least a partial bounce. This bounce should be played only by the most aggressive market participants, or day traders. The picture is murky after such a poor day on Friday and it is best to take a step back and wait for more information before making any decisions.

Friday, January 20, 2006

Conditions Dramatically Improve

Earlier this year Jim Cramer, who tends to be quite forceful with his opinions and whose opinions tend to change quite often, touted this 2006 market as the strongest market he had seen in six years. We tend to think he is right. This week things looked a little bleak and there were some legitimate reasons to worry that we were on the verge of a repeat of December's pullback. Last year breakout moves were frustratingly sold into and pullbacks like the one that began last week always turned into something worse as the market forced equilibrium. This pullback was not harsh nor was it frustratingly long. During this pullback accumulation indicators continued to diverge bullishly and poor reports from old the market leaders INTC and YHOO were used by smart money as buying opportunities. Yesterday the indices experienced a sharp reversal and the Russell 2000 small cap index forced yet another all time high. Today's scans confirm this move. We saw some of the strongest charts we have seen in quite some time. What we are now watching for is a NASDAQ 100 channel breakout. Recall that the QQQQ (NASDAQ 100) has been in an uptrending channel, but has been bumping against overhead resistance. If the trend is going to make some real strides, it will be necessary for the QQQQ to break out of overhead resistance allowing the trend to accelerate. The attempt to break this resistance that started January 2 was doomed to fail since it had not time to consolidate. Now we had a nice short pullback and volume has been strong creating a very good higher base of support. The set up is now in place for a breakout. Will it do so? Who know? What we do know is the set up doesn't get any better than this. A QQQQ weekly close over $43.30 would confirm an accelerated trend breakout.

Thursday, January 19, 2006

The Guessing Game is for Losers

We rolled through today's scans looking through chart after chart finding nothing but a whole lot of neutrality. This makes sense if you think about it. Options expire tomorrow, YHOO and INTL reported yesterday causing a significant gap down so a whole lot of people are afraid to make a decision here. Why buy when it is unclear whether the market will get hammered on today's Apple report? Why sell when the current pullback is getting close to overdone and there are two gaps overhead that still need to be filled? What this leaves are a whole lot of charts that are just not projecting much. This leaves us with two choices: We can either guess what we think the market will do here or we can wait for the market to show us. Nobody survives in the market very long if they make a practice of guessing, so we will wait.

Wednesday, January 18, 2006

Momentum Gives Way to Uncertainty

Pressure from an overbought market that is up against resistance, higher oil prices, and options expiration week have all come together to put pressure on the indices. Additionally, breadth figures were poor yesterday meaning that market pressures are weighing fairly heavily across the board. Good trading conditions will return soon, but what we are faced with as we move closer to Friday's options expiration is a poor trading environment where money is much more easily lost than gained. It is time to be defensive, to keep your stops, and to take partial profits when they are on the table. Poor trading conditions are not expected to last past options expiration on Friday. In other words, this is most likely a temporary set back in a larger trend.

Tuesday, January 17, 2006

Momentum Continues

Scans today suggest that the underlying bullish trend continues to have momentum. Pull backs in some areas now appear to be feeding breakouts in other areas. We are finally getting some decent pattern set ups indicating that buyers have been accumulating second tier stocks during the run ups of first tier stocks like Rambus (RMBS). Considering the fact that the NASDAQ has overhead channel resistance just above its current price, we believe that a run higher prior to a pullback would be bullish as it would set up a higher level of support. Nevertheless, with prices as extended as they are, anything could happen here so it is better not to project wants into the market and take a wait-and-see position.

Friday, January 13, 2006

Are Dip Buyers Really This Impatient?

An interesting event occurred right at the close yesterday. In afternoon trading the indices broke down and from 2 p.m. until the close all major indices traded in bear flag patterns. This is a typical pattern that suckers in pullback traders and that generally signals the beginning of a correction. What is unusual this time is the heavy volume after 2p.m., which culminated into a very large buying spike at the close. Could it be that buyers are so eager to get in that they are refusing to wait for a proper pullback? 
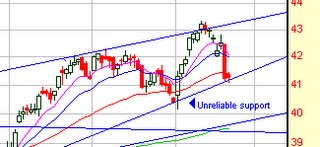
If this does turn out to be the case and yesterday's bear flag fails we could see a mad scramble. Such a scenario would have pullback buyers in the wings battling with the bears who just shorted what they thought was the top. This would create an explosive situation where prices are driven much higher than most market analysts now consider reasonable. What to watch for: If the QQQQ moves (not just quickly dips, but actually moves) below $42.80, then yesterday's bear flag will have succeeded and we will likely see further pulling back from current levels. If not, then today and next week could see some fireworks.

Thursday, January 12, 2006

Hoping for Some Consolidation

While the QQQQ broke above its overhead trend channel and the SMH moved to new highs it would be a bit Pollyannaish to expect gains to go into hyperbolic mode without some pullback or consolidation first. In fact, we would prefer to see gains consolidate for a while and perhaps pull back just sharp enough to scare out the new longs. Up trends are great, but when everyone is bullish at the same time the trend can be jeopardized.

Wednesday, January 11, 2006

Buyers Don't Back Down

Buyers are waiting below soaking up the dips so we could see this rally continue unabated for at least a few more days. Nevertheless, expect quick, frightening pullbacks that shake out weak longs. Looking at the longer term charts, technically there is no reason why we couldn't see a repeat of the type of rally that occurred from the April 2003 breakout, which didn't top off until January 2004. We are already starting to see some of the hyperbolic moves in some of the more high beta stocks that were so prevalent during that rally. Over the past two years traders have been conditioned to sell the breakouts and we have struggled to make 10% gains. Longer term subscribers will remember that during the 2003 it was not uncommon to see stocks make quick 20%, 30%, and even 50% or more gains. We are not trying to put subscribers in an overly exuberant mood where reason is thrown out the window. There are no guarantees that we will see a repeat of 2003 this year. However, we are trying to get everyone to look at the bigger picture and to start thinking less along the lines of "sell the breakout" to "let's exercise a little more patience so that we don't miss the larger moves."

Tuesday, January 10, 2006

Risk of a Pullback Increasing as Bullishness Grows

The crowd is getting overly bullish here and that makes us a bit nervous. Price could certainly continue to climb from current levels. In fact it is likely. The risk of a quick reversal triggered by profit taking increases with each higher high the market makes here however. We consider a pullback to be a buying opportunity, but keep in mind that bull markets sometimes experience sharp pullbacks that trigger stops and frustrate traders. Our time frames are not long term so a pullback that is too sharp can quickly wipe out profits on the table. For the reasons stated here it is better to stay conservative until the market pulls back and provides better entries.

Monday, January 09, 2006

Semis Lead the Way to a Strong Start for 2006

A couple of months ago we noted that the NASDAQ 100 (QQQQ) and the semiconductors (SMH) were leading the rally that started last October. In late November, early December both of these indices broke above multi year resistance levels and we noted that these breakouts would have a significant impact on trading results for 2006. After breaking out, these two indices along with the broad market spent the month of December moving sideways in consolidation modes. Towards the end of the month when the Santa rally failed to arrive bears were preening and bulls were singing woes as both groups looked for the sky to fall. We remained obstinately bullish during December's pull back for what we believe are good reasons. Friday our reasons for remaining bullish were profoundly confirmed on two important weekly charts (keep in mind that a weekly chart view is much more reliable at determining the longer term direction of a stock or an index than the daily view). Over the past 20 or so years one overlying truth has been that the market cannot sustain a move without the semiconductors. This may not be true forever, but at this time we find that the semiconductor sector remains an important leader. It is very bullish then that the semiconductor sector has taken the lead once again and as of Friday this sector has strongly confirmed November's breakout. After a test of support the SMH bounced back strongly last week and on Friday a breakaway gap over multi year resistance was achieved. Despite what the talking heads might say, despite how poorly the bears paint the economic picture, despite all the negativity you are bound to hear over the coming months, keep in mind that the chart says that smart money has been accumulating and now shorts are starting to realize that they have been wrong. We are now in the early phase of a strong move.

The QQQQ chart is interesting here, for while it also confirms the strong breakout, it is up against its overhead trend channel resistance. One of two things can occur here. Either it can maintain its current slow climb and pull back to support or it can break higher as the trend accelerates. Friday's strength suggests that the trend will accelerate. The strength of the broader market suggests as much as well.

Friday, January 06, 2006

Watching the Semis

The NASDAQ 100 and S&P 500 have both moved up to very significant levels. Both indices are back up near last year's highs, both have been moving up on solid volume, and both have room to continue the run before technicals become overbought. It is important that these indices either break through to new highs or base for a while at these levels. If they get turned back here it would be quite bearish and will make for difficult trading for the next few weeks. In addition to the bullish technicals, the good news is that double tops are rare so let's hope the bulls can keep this rally going for just a while longer. For argument's sake, let's place ourselves in the shoes of the bears here. Perma bears have been trying to catch a top every time the market has rallied over the past couple of years as they look for impending doom to set in. When they have turned out to be wrong their short covering has juiced the rallies allowing the markets to climb a wall of worry. Here we are once again back at last year's highs, an area that constitutes multi year highs. What better place for perma bears to put on new short positions in an attempt to catch the top? Specifically we are once again watching the semiconductor indices. The SMH closed back at last year's highs yesterday. Shorts were likely put on side-by-side against the long bets yesterday. If the SMH can move over $39.15 or simply just close over $39.00 we should see some very explosive action as shorts start getting stopped out and the overwhelming realization that they were wrong once again takes hold. Someday they may catch the top the precedes the big crash, but we are betting that this time will once again be wrong.

Thursday, January 05, 2006

Trend Up, but Some Indecision Here

While there are pockets of strength that should now be freed up to trade slightly independent of the major indices, major indices are up against daily resistance levels and it is yet unknown whether we will get a break through to new highs or a re test of support. Our scans don't give us an edge here on the direction the market will take and they essentially confirm indecision. The bottom line is that the major uptrend is alive and well and we expect gains to continue over the next few weeks. At the same time, the immediate trend could either reverse back near Friday's lows or could break to new highs. A move back to Friday's lows should be considered a buying opportunity. A move below Friday's lows would be bearish, but such a move is not expected.

Wednesday, January 04, 2006

Bulls Take Firm Control

Yesterday's strong move higher was a clear accumulation day and should set up a foundation for a move higher as we start out the 2006 trading year. We wouldn't be surprised of some of yesterday's move is faded today as pros shake the tree a bit more in an attempt to weed out the momentum bulls. Yesterday's move is reminiscent of October 19 where the bulls clearly marked their territory. Keep in mind that the lows were tested a few days later and panicked momentum players were shaken out just before the strong November move. Beware as this could happen again. Have confidence in the fact that bulls have once again marked their territory.

Tuesday, January 03, 2006

2006 Starts On Better Footing Than 2005

We started the year 2005 on the heels of a strong Santa rally that had the market trading at new highs. The market rewarded exuberant traders with a long bloody slide that lasted until April 2005. For those fearing a similar scenario, fear not as conditions are distinctively different this year. We now embark on 2006 with oversold stocks, which have not only evidenced strong accumulation creating a nice divergence, but also with major indices having merely pulled back toward their multi year breakout levels. Don't underestimate the significance of last November's market breakout. Yes we experienced profit taking into the year's end, but indicators reveal strong signs of accumulation taking place during this bout of profit taking. We won't make any predictions about today as the immediate down trend is still in effect until its not, but we will make the argument that this market is setting itself up for a continuation of November's breakout.