Our stock trading strategies are based on surprisingly simple yet effective no nonsense logic that is uncommon in the stock market. For our short term trading strategy we: Buy at support; we take small, quick profits; and we use the 10/2 rule so that we never slip backwards.
Thursday, October 30, 2008
Stalemate
The indices sit right below resistance and no one has yet blinked. Do we get a breakout and ensuing short squeeze or do we get another rejection? Time will tell so hedge your positions here.
Wednesday, October 29, 2008
Falling 20-day Average Attracts More Selling
The ever elusive follow through day day failed to arrive. Buyers may surprise us here over the next few days but the fact that the S&P 500 was turned back at its falling 20-day average must be sobering to the bulls.
A couple of days ago it looked as if the October lows would fail. Now we have to wonder if a retest and perhaps a failure of those lows remains in the picture.
Time will certainly tell.
A couple of days ago it looked as if the October lows would fail. Now we have to wonder if a retest and perhaps a failure of those lows remains in the picture.
Time will certainly tell.
Tuesday, October 28, 2008
SPY Takes a Goal line Stand
The market stood once again at the abyss but buyers stepped in and saved it at what could potentially turn out to be a double bottom.
What traders need before they can once again hold long positions overnight, however, is to find that ever elusive animal called "a follow through day."
Traders might wish to tighten up stops on short positions though.
What traders need before they can once again hold long positions overnight, however, is to find that ever elusive animal called "a follow through day."
Traders might wish to tighten up stops on short positions though.
Monday, October 27, 2008
October Low Unlikely to Hold
October's low clearly is in jeopardy of breaking down. Considering the lack of bullish divergences on any major index or on the majority of stocks a break through the October 10th low has a great deal of potential to create a panic washout.
Moreover, sentiment readings remain surprisingly bullish with 52% of the traders still looking for a bullish bounce against only 21% looking for more lows to come. With readings like this and with the sellers still in charge of the tape, the short side looks to continue to be profitable.
Moreover, sentiment readings remain surprisingly bullish with 52% of the traders still looking for a bullish bounce against only 21% looking for more lows to come. With readings like this and with the sellers still in charge of the tape, the short side looks to continue to be profitable.
Saturday, October 25, 2008
Continued Distribution Takes Place
Last week the major indices tested October lows. Unfortunately for those looking for a bounce, there is no sign yet that the selling is letting up or that buyers are ready and willing to step in and support the lows put in earlier this month.
In fact, what we are seeing instead is continued distribution and continuation set ups.
Let’s take a look at the intraday chart on the SPY for an example of what is taking place almost across the board.
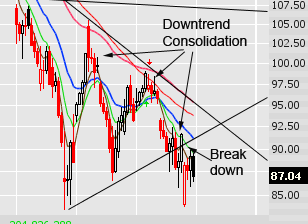 Note that following the big up day on October 13, which can be seen on the chart above as the first wave up, prices have consolidated in a contracting continuation pattern.
Generally these patterns resolve themselves in the direction of the trend and indeed, on Friday, it did resolve to the downside.
This appears to be the beginning of a fresh leg lower.
The only qualification that needs to be made here is the acknowledgment that the market is just so oversold here. The breakdown of this continuation pattern could potentially be a headfake that squeezes new short positions. But, there is no reason to conclude that it might be a headfake other than the fact that the market has supposedly already traveled far enough. We have no evidence that it has and all indicators are showing continued distribution here so probabilities are higher that the breakdown was real and that we will see lower prices from here.
In fact, what we are seeing instead is continued distribution and continuation set ups.
Let’s take a look at the intraday chart on the SPY for an example of what is taking place almost across the board.
 Note that following the big up day on October 13, which can be seen on the chart above as the first wave up, prices have consolidated in a contracting continuation pattern.
Generally these patterns resolve themselves in the direction of the trend and indeed, on Friday, it did resolve to the downside.
This appears to be the beginning of a fresh leg lower.
The only qualification that needs to be made here is the acknowledgment that the market is just so oversold here. The breakdown of this continuation pattern could potentially be a headfake that squeezes new short positions. But, there is no reason to conclude that it might be a headfake other than the fact that the market has supposedly already traveled far enough. We have no evidence that it has and all indicators are showing continued distribution here so probabilities are higher that the breakdown was real and that we will see lower prices from here.
Wednesday, October 22, 2008
Continuation Patterns
The market is awash in continuation pattern breakdowns after yet another day of selling. We will take a look at these in a moment. First, we need to note that we are suspending the use of the SRS Risk Assessment Meter (RAM) for the time being. The character of the market changed when we experienced what can only be considered a market crash.
The RAM will be useful again, but it will take some time for the market to repair itself and for a new price mean to appear which we can use in our regression analysis.
Let's take a look now at pennant continuation patterns:
The stock CF, which we recommended to our subscribers this week, is a good example as there are a large number of stocks in the market exhibiting similar patterns right now.
CF is in a strong downtrend, represented by an ADX reading near 50 (35 is typically considered a very strong trend, so 50 is extreme). CF broke down from its consolidation area, which formed a pennant pattern on the daily chart. This should kick off a fresh leg lower from here.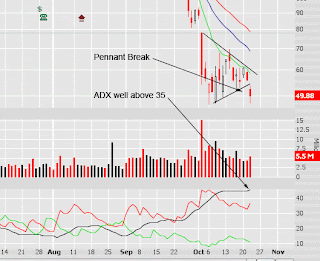

Monday, October 20, 2008
Light Volume Rise - Don't Trust It
Prices have risen on decreasing volume over the past two trading days. There is no reason to chase prices here. Volatility is likely to remain. A retest of the bottom may yet be in store. If prices continue to rise on lower volume shorting would make much more sense than buying.
Wednesday, October 15, 2008
Warning
The SRS Risk Assessment meter tells us that the downtrend is close to a bounce. However, the sellers are just not letting up here. We recommended in yesterday's report to start looking for long positions. We were early.
Until the sellers let up and we get confirmation via a follow through day - which we have not seen yet - then it is best to stay defensive.
In fact, a plethora of stocks broke lower out of thrust pullback patterns today indicating that more downside may be ahead.
Again, stay defensive. The S&P may have to test $750 before serious buyers step back in. It boggles the mind, but it is what it is.
Tuesday, October 14, 2008
Short Side Risk Very High
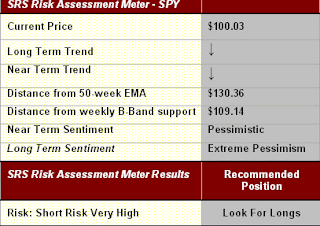
The beauty of the SRS Risk Assessment Meter (RAM) is that it gives us a reasonably accurate view of the risk factors when the market is at extremes.
For example, last May when the market was going up we warned based on the RAM that the market was due for a big correction and that it was best to start looking for short positions. We started warning when the SPY was trading near $138. The SPY was able to trade just over $142 following our warnings trapping in new longs before it turned sharply lower. The RAM did its job.
Now we are at a juncture that is the exact opposite of the situation we had back in May. The RAM is warning that risk is extremely high on the short side and probabilities heavily favor a price rally that allows the market to revert back to its mean. Reversion back to the mean might mean a lower high, but given the extreme sell off we have just experienced a rally that creates a lower high can indeed still be a significant tradable rally.
We don’t know just how far the pullbacks will be here but rest assured probabilities heavily favor the dip buyers here after last week’s intermediate capitulation event.
Thursday, October 09, 2008
Near Term Sentiment Finally Spikes
Throughout this crash near term sentiment readings have showed bearish readings, but have failed to reach up to the type of extremes we needed to see to mark the end, or at least begining to the end of this waterfall crash we have been experiencing.
This has finally changed. Sentiment Trader's Short Term Sentiment indicator finally spiked today giving us an overly fearful situation. With the VIX now at all time highs traders have to consider the fact that this decline is very close to an end; or at a minimum a relief rally.
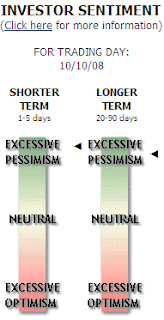
This has finally changed. Sentiment Trader's Short Term Sentiment indicator finally spiked today giving us an overly fearful situation. With the VIX now at all time highs traders have to consider the fact that this decline is very close to an end; or at a minimum a relief rally.

Keep The Big Picture In Mind
All anyone can do after a day like today – or a month like this month – is just shake one’s head in disbelief. We have never seen declines like we have seen in the market over the past few weeks. The one month decline in the SPY is now almost 27 points or 23% and the month is only 9 days old. By comparison, the biggest one month decline in the SPY during the last bear market was only 20 points, or 22%.
Moreover, the fear index (VIX) is now trading at all time highs.
In times like this it is important to keep the big picture in mind. We admit we were astounded today when our stops on SPY and SSO were sliced through like a hot knife through butter, but realistically we have taken a very conservative approach to this market throughout the year. We still have significant gains on the year. A quick look at Morningstar tells us that the only funds that have a gain on the year are just a small handful of bear market funds; roughly only 20 out of 13,000 funds. The rest of them have losses on the books as of the end of September; significant losses after this market crash to be sure.
More importantly, however, is the vast opportunities that this produces for us. Having preserved our cash we will be in great shape to participate in the upcoming rally. And considering the strength of the sell off and the fact that world governments are now moving heaven and earth to stop the spiraling out of control, we are looking at a massive rally out of this bear market.
First, we a huge bear market rally WILL follow this extraordinary sell off and that rally will offer us moves that are likely to easily surpass our typical 10% price targets. We still contend that that rally could kick off any day now. And, and this is even more compelling, considering fear levels now, a lot of babies have been thrown out with the bathwater here and valuations in some companies are exceedingly cheap here, we are likely very close to the end of this bear market altogether.
Bear markets tend to end much sooner than recessions do as the stock market is forward looking. What is truly great about the prospects for the next bull market is the fact that they are just so much easier to profit from. In 2003, when the last bear market was recovering, we saw huge gains. Stocks that rallied 20, 40, 50, and even 100% in one day were common during this phase and they will be again. Over the past couple of years the market had lost its momentum and it was hard work getting just 10% gains. This will not be the case during the first phase of the bull market when undervalued stocks revalue.
So today, we have moved back to cash, but we eagerly wait for the profitable bounce and have no doubt it will be a big one following this historic sell off. There is nothing new under the sun and this sell off certainly is no exception.
Tuesday, October 07, 2008
The Spring is Wound Tight
The further away from the 50-week average the SPY trades the bigger the rebound rally that will follow.
Right now the SPY is an astounding 30 points away from this area where it has historically regressed to in bear markets. Moreover, the price is over 9 points below its weekly Bollinger Band support. This is a classic oversold condition.
The spring is wound tight in this market and a rebound is surely just around the corner.
Today we panned back to the monthly view to see where we might find support. During the last bear market the SPY tagged the 200-month average two times right before a new bull market kicked off.
It’s too early to tell if this is the final capitulation in this bear market, but the 200-week average appears to be drawing the price in like a magnet. In our opinion, a touch down at that average would make for an incredible buying opportunity.


Monday, October 06, 2008
Hammers Are NOT Giving Us An All Clear Signal
We really wanted to get in there tomorrow and start picking up some of these beaten down shares that are just sooooo technically extended at this point. Today we scanned for hammer bottoming signals and incredibly more than 1100 showed up in stocks that trade more than 200k shares per day.
Hammer buying signals are signals which occur when the price washes lower for the day but then experiences a rally late in the day and closes near the opening price.
We have decided against buying any new shares tomorrow as the hammer signals we found have some problems with them, which we will explain.
First, let’s take a look at a classic hammer buy signal put in by the stock STLD today.
 Note that STLD was able to close out the day near daily highs after quite a frightening sell off intraday. Typically this type of trading gives us an indication that capitulation has taken place, which is a pretty good buy signal under the right circumstances.
Nevertheless, the hammer signal on STLD has some problems; not the least of which there is no clear support in sight. Even more problematic, however, is the fact that we don’t have strong evidence that late day buying was serious. In fact, just the opposite is true.
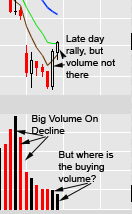 If we drill down to STLD’s intraday chart (hourly) we can get a better look at the seriousness or lack thereof that late day buying entailed. STLD sold off on heavy volume, which is potential capitulation, but where is the buying volume late in the day?
Clearly late day buyers were not very enthusiastic. In fact, the late day bounce looks to us to be more of the short covering variety than it does serious institutional interest or program trading.
This intraday picture is repeated over and over in the market today. Yes we had a late day bounce. No, that late day bounce does not give us the all clear signal.
We are probably near a tradable bottom, and if tomorrow we see a rate cut in the US and Europe then buyers might start getting serious. But for now, all we have seen is a late day lull in the selling and that is no reason to buy stocks by any shape or means.
Hammer buying signals are signals which occur when the price washes lower for the day but then experiences a rally late in the day and closes near the opening price.
We have decided against buying any new shares tomorrow as the hammer signals we found have some problems with them, which we will explain.
First, let’s take a look at a classic hammer buy signal put in by the stock STLD today.
 Note that STLD was able to close out the day near daily highs after quite a frightening sell off intraday. Typically this type of trading gives us an indication that capitulation has taken place, which is a pretty good buy signal under the right circumstances.
Nevertheless, the hammer signal on STLD has some problems; not the least of which there is no clear support in sight. Even more problematic, however, is the fact that we don’t have strong evidence that late day buying was serious. In fact, just the opposite is true.
 If we drill down to STLD’s intraday chart (hourly) we can get a better look at the seriousness or lack thereof that late day buying entailed. STLD sold off on heavy volume, which is potential capitulation, but where is the buying volume late in the day?
Clearly late day buyers were not very enthusiastic. In fact, the late day bounce looks to us to be more of the short covering variety than it does serious institutional interest or program trading.
This intraday picture is repeated over and over in the market today. Yes we had a late day bounce. No, that late day bounce does not give us the all clear signal.
We are probably near a tradable bottom, and if tomorrow we see a rate cut in the US and Europe then buyers might start getting serious. But for now, all we have seen is a late day lull in the selling and that is no reason to buy stocks by any shape or means.
Friday, October 03, 2008
Weekly Bollinger Band
During the last bear market the SPY closed the week out below the lower weekly Bollinger Band three times. Following each time this occured the market turned higher into a multi week rally.
This bear market has now seen its second weekly close below the weekly Bollinger Band. The first time this occured was Friday, January 18. Monday, January 21 the SPY gapped lower at the open, but buyers stepped in immediately and they didn't quit until the SPY had rallied all the way from $129 to over $135.
This bear market has now seen its second weekly close below the weekly Bollinger Band. The first time this occured was Friday, January 18. Monday, January 21 the SPY gapped lower at the open, but buyers stepped in immediately and they didn't quit until the SPY had rallied all the way from $129 to over $135.
Thursday, October 02, 2008
Taking a Look at Recent Trades
Using the Risk Assessor as our guide it is our opinion that the recent downtrend has stretched too far from the 50-week average for a safe short trade. We would prefer to play the trends when risk is low, but when trends get extended, we would rather let others assume the extraordinary risk if that is their desire while we wait for the inevitable turn.
We keep an eye on a number of blogs and read a large number of analysts in our daily research. One common experience we have read over the past week has been that traders are getting stopped out by the massive volatility that exists in this market; and this includes those who are attempting to play the short side.
We, on the other hand, took profit on our short trades last week and started looking at areas where the heavy risk in this market could be mitigated. As a result we missed some of the sharp downside moves we have seen but at the same time we have not been experiencing painful stop outs either.
In fact, we have been able to turn a small profit in this environment.
Let's take a look at two of our trades this week:
CPB
Earlier this week we noted that attempting to pick a bottom in this market was akin to trading suicide. What we recommended instead was a focus on stocks that have both held up well during the recent downturn and which are experiencing institutional buying interest. Cambell's Soup (CBP) was just such a stock.
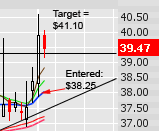 On Wednesday we put in an order to buy CPB at $38.25. As you can see on the chart above that order filled and then shot sharply higher. This market has been tough and it has rewarded those who are not greedy, so we plan to take profit at $41.10. We have moved our stop up above our entry point just in case something goes wrong.
THS
THS is another stock that fit our criteria. This sector isn't prone to the same types of risk other sectors are prone to in this market. People don't stop buying food when the economy turns down.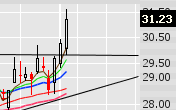 We attempted to buy THS at $28.60 on Wednesday. When that didn't fill we moved up our order to $29.50 today.
THS found early buying interest and our order didn't fill. Nevertheless, it serves as a great example of a stock that both works well in this market environment and one that does not require traders to stick their face in the buzz saw of risk that exists when the market is so extended like it is right now.
We keep an eye on a number of blogs and read a large number of analysts in our daily research. One common experience we have read over the past week has been that traders are getting stopped out by the massive volatility that exists in this market; and this includes those who are attempting to play the short side.
We, on the other hand, took profit on our short trades last week and started looking at areas where the heavy risk in this market could be mitigated. As a result we missed some of the sharp downside moves we have seen but at the same time we have not been experiencing painful stop outs either.
In fact, we have been able to turn a small profit in this environment.
Let's take a look at two of our trades this week:
CPB
Earlier this week we noted that attempting to pick a bottom in this market was akin to trading suicide. What we recommended instead was a focus on stocks that have both held up well during the recent downturn and which are experiencing institutional buying interest. Cambell's Soup (CBP) was just such a stock.
 On Wednesday we put in an order to buy CPB at $38.25. As you can see on the chart above that order filled and then shot sharply higher. This market has been tough and it has rewarded those who are not greedy, so we plan to take profit at $41.10. We have moved our stop up above our entry point just in case something goes wrong.
THS
THS is another stock that fit our criteria. This sector isn't prone to the same types of risk other sectors are prone to in this market. People don't stop buying food when the economy turns down.
 We attempted to buy THS at $28.60 on Wednesday. When that didn't fill we moved up our order to $29.50 today.
THS found early buying interest and our order didn't fill. Nevertheless, it serves as a great example of a stock that both works well in this market environment and one that does not require traders to stick their face in the buzz saw of risk that exists when the market is so extended like it is right now.
Upside Surprise Potential Remains High
As we have been discussing in recent updates, this is no time to step in and try to catch a falling knife. Nevertheless, the potential for an upside surprise remains strong.
The SPY is extremely oversold on a weekly basis and has dipped down below monthly support. The potential for prices to hold near current levels and rally firmly higher are much more likely from a technical point of view than further significant downside is.
The SPY is extremely oversold on a weekly basis and has dipped down below monthly support. The potential for prices to hold near current levels and rally firmly higher are much more likely from a technical point of view than further significant downside is.
Subscribe to:
Posts (Atom)