Securities Research Services

Saturday, August 27, 2005

This Week's Schedule

The market blog will not be updated this week as the analyst who normally contributes his daily market analysis will be on vacation. The blog updates will resume on Monday, September 5, 2005. Have a great week everyone!

Friday, August 26, 2005

Let's Take a Look At Where the Advantages Are Now
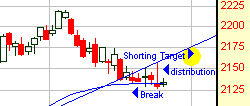
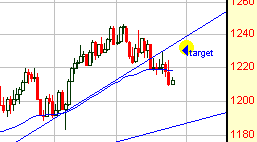
August has watched the market chop up and down making it difficult to predict direction. This week however we experienced a clear distribution signal as both the NASDAQ and S&P sold below their trend lines on heavy volume. Currently the market is very oversold and clearly we are due for some sort of bounce. Wednesday’s sell off however was a warning shot across the bow for the bulls. We argue that smart money has been using choppy trading this month to sell off the tops wearing out the ammunition bulls had in their arsenal. This means that any rally that begins from current levels will do so with odds favorably against its success. Let’s take a look at the NASDAQ and S&P charts so that we can see what stocks are up against here. While the NASDAQ 100 broke its trend only this week, the NASDAQ itself chopped through its trend over a week ago. On Wednesday it tried to recover, but instead experienced a strong distribution day. Keep in mind that it is very oversold here and due for a larger bounce. We argue that that larger bounce will only take it to the under belly of its broken trend where it will face daunting resistance. When it does return to the broken trend it is likely going to be a very nice short.

The S&P is in much worse shape, but the scenario is the same. We are looking for an oversold bounce to take it back to its broken trend. This will set up a short opportunity.
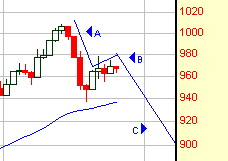
Now let’s take a look at the oil sector. We’ve been mentioning this week that it looks to be working out a topping pattern. Oil prices experienced a sharp correction last week and have since merely moved back up weakly in what we believe to be the “B” leg of an A, B, C downward correction. Prices could move slightly higher from here, but they are under pressure and are very likely to experience a heavy amount of resistance at current levels. Why? Markets forming tops after a strong trend often have a sharp sell-off and then make one last attempt to resume their longer term uptrend. This resumption is caused by bargain hunters buying at what they perceive to be low levels and by shorts taking profits (buying to cover). And, it can be accelerated by shorts being squeezed out. However, this action often exhausts itself before the market makes it back to its old highs. When this occurs, a true top is then formed. The chart below is of the oil services index, XOI and the pattern described here fits this chart very well.
Thursday, August 25, 2005

An Important Support Failure Occured Yesterday

We’ve looked and we just can’t find anything positive about yesterday’s index breakdown. The reasons why it occurred don’t matter nearly so much as how the market reacted to the reasons. Whether it be derivative issues, high oil prices, or speculation that the fed might overshoot on interest rates, the fact is the market sold off at support and it sold off hard. The toughest part about market analysis and the toughest part about trading is trying to determine whether a market pullback is just a simple bit of profit taking or whether it represents a character change. If it’s just profit taking you try not to fight it, but you don’t get aggressively short since it doesn’t take much to trigger a reversal. If it’s a character change, then you don’t know until you get some sort of confirmation. Yesterday provided confirmation that we are experiencing a character change from the bull trend started last April. We now know why August has been such a miserable month. Smart money has done a good job recently at hiding its intentions. They have been leaving small footprints, likely by setting up program trading to sell small amounts at daily price extremes. This has weakened the will of the buyers to the point that yesterday they had no more ammunition left when they were forced to defend the uptrend. We won’t make any projections at this point what sort of target to look for or how long this downtrend will persist. We need more information before we can do that; in other words, time. Right now the market is still very deeply near term oversold and due for a bounce. What changed after yesterday’s sell off however, is that now we need to use the bounce to find shorts. The sell off confirmed the downtrend and there is nothing worse than trying to fight against the trend. We’ve tried to avoid the trend all month by focusing on commodities, but even these areas are destabilizing. Oil, which sold off hard last week, is in the throws of a bounce here. We would argue that it looks like a topping pattern underway. Gold broke out a few weeks ago in what it turns out was merely a bull trap. The breakout failed this week and gold prices look to reestablish their downtrend or at least trade sideways for a while. Today we need to watch the market’s reaction to yesterday’s selling to see where to best position ourselves. Scans are not yet turning up strong short patterns and long patterns are not to be trusted for the time being. Note: Check the calendar for updated instructions on the stocks TSM and AEM. Likewise, we will be providing an email update on long term stocks to Gold and Bronze members today.

Wednesday, August 24, 2005

Bounce Still Imminent

Oil prices are once again shooting higher. It’s hard to determine yet if this is part of a topping pattern or if prices will continue to move higher. Considering the hard sell off last week, we would tend to lean toward the theory that oil is in the throws of a topping pattern. Meanwhile, though market indices did next to nothing yesterday, a number of small cap stocks were once again popping higher out of their bases. We didn’t find much that was tradable with our own risk guidelines, but the fact that there are some areas of strength returning to the market indicates that selling pressures are easing significantly while the market continues to test support levels. Options traders once again spent the day yesterday buying nearly twice as many puts as they did calls. This overly bearish position by this group of not so lucky traders continues to strongly support the contrarian view that we are at the bottom of the correction.

Tuesday, August 23, 2005

Expecting a Bounce

Underlying breadth wasn’t particularly strong yesterday, though scans didn’t turn up anything particularly negative that might warn us that we are at risk of a breakdown here. The wide ranging doji at the trend lines on both the NASDAQ and S&P indices is about as good a reversal signal as any other we have come across and we need to honor it (see QQQQ chart below). The signal is complimented by both oversold, but improving technical indicators and by the fact that options traders have reversed course from an overly bullish position to one that is overly bearish. Options traders are very good at calling reversal points in the market in that they are so often very wrong in the positions they take. When a majority of call options are being purchased like they were at the end of July and the first of August, we can just about be assured the market is overbought and ready to collapse. Likewise, when a majority of put options are being purchased, we know that these unlucky traders are becoming overly bearish and that a reversal to the upside is fairly imminent. Yesterday they were buying puts hand over fist. Allow for some volatility here. They may try and shake loose a few more shares before it reverses and suck in a few more unlucky put buyers, but we can just about be assured the market will bounce from very close to current levels. We don’t know how strong the bounce will be yet as there is just no way to determine this. It makes sense to start buying at these levels though and then make adjustments as necessary later on.

Monday, August 22, 2005

Watching Market Sentiment Closely on Monday

The market closed out options week with indices resting on support and with indicators revealing oversold near term conditions. We need to see bulls make a stand here. A bounce at or very near current prices is almost assured. In order for it to be tradable on the long side, we need to see bulls step back in with volume. We are watching closely to see how stocks trade on Monday as this will surely give us a more accurate representation of the underlying sentiment of smart money. Options expiration, which is now behind us for another 4 weeks, always skews this sentiment.

Friday, August 19, 2005

Cash is King this Week

Trading conditions this week have been about as severe as we can recall from recent memory. Add to this the fact that market sentiment is skewed by today’s options expiration and the only logical conclusion to make is that all short term money should be in cash (gold may be an exception to this rule, but it needs to hold support at this level for this to remain true). The market is at a very precarious stage in its cycles. We had evaluated the QQQQ earlier this week and determined that it had more room to fall before finding trend support. It turns out however that what is true for the QQQQ is not in fact true for the NASDAQ or the S&P indices. These two indices have arrived at their battlegrounds and what occurs here will determine which side of the trade we need to be on for at least the next few weeks. The NASDAQ, as you can see from the chart below, closed slightly below its uptrend yesterday and is trading below its 3-year breakout highs. It must hold at the 50-day average and volume must come back in or the bears are going to have a hay day on a retest of the 2170 area.

The S&P is at an equally important line of last defense. It has broken its uptrend and is now trading at its 3-year breakout support. If its 50-day average breaks down here it will be time to start looking to position ourselves in short positions and defensive sectors.
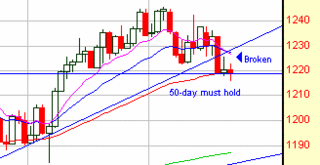
Going into today, we take the technical threats these two indices are faced less seriously than normal. Options sellers have near perfect conditions under which to manipulate prices into their maximum pain levels and this week’s trading reveals that this is exactly what they have been doing. Today we await the outcome looking for volume and price to move higher or waiting for a slow drift and a breakdown. Either way, the uncertainty of this week will soon be behind us.

Thursday, August 18, 2005

Risk is Spiking in Front of Options Expiration

Near term conditions are oversold yet indices and a majority of the stocks in the market don’t have support yet either. Add to this serious volatility in the commodities sectors surrounding oil inventories, PPI numbers, the dollar’s dead cat rise, and then throw in options expiration into the mix; conditions could not get more risky. This market is a guessing game over the next few days. Further out we have a pretty good idea what we think is going to happen. We laid this out in yesterday’s report. What will happen over the next couple of days is another story. We had a handful of stocks show up in the scans with both long and short set ups. When market conditions are as unstable as they are right now though it is important to look at these set ups very skeptically. As much as we like to keep our money working for us, we just can’t find any better place to put that money to work that is better than cash right now. We may be stuck in this rut until at the very least tomorrow’s options expiration is out of the way.

Wednesday, August 17, 2005

Last Wednesday we provided a chart of the QQQQ (NASDAQ 100 ETF) projecting a minor trading range creating wave B in an ABC correction. Yesterday the B wave concluded and the projected C wave down began. Now realize that we take Elliot theory with a grain of salt and believe that its predictive power is more a myth swallowed by the true believers than it is a reality. However, sometimes patterns do repeat themselves in the market and when we are able to recognize this occurring it can lead to really great trading opportunities. So far the ABC correction we are now experiencing is mirroring the same type of correction that occurred during the month of June. It is too early yet to buy, but when the QQQQ hits its trend line at the $38-level it will be time to start buying the down days. We are looking for about a week of consolidation at the trend line so don’t get overly anxious looking for a quick bounce. Instead, use this as an opportunity to get positioned for what should be a strong move off of heavy support. The market is very oversold already and shorts are likely to pile on at this level. In our opinion it is too late to short for longer than a day trade, but the shorts that do enter at these levels will add much fuel to the reversal once the market hits support. Meanwhile, options week is playing havoc with the commodities sector and the dollar’s dead cat bounce from a deeply oversold condition has slowed momentum in the metals sectors. We believe this is temporary and that we will see the metals start to regain some momentum now that some of the pressure has been taken off of the dollar’s slide. The oil correction should lead to more buying opportunities since it has not yet created a topping pattern in a very strong trend.

Tuesday, August 16, 2005

One Day Up, One Day Down to Continue

The red bar, green bar trading range saga continues. Today’s low volume up day shouldn’t fool anyone. If the market stays true to its current character we expect today to be a down day, which should take indices and stocks back down to the bottom of the daily range. In other words, near the starting point of yesterday’s market. A few more days of this type of action appears to be in store and then we would expect a stab lower. If we can find a good short set up to take advantage of what is sure to be a very quick move lower, we will provide it. Right now there is so much neutrality in the market that finding the advantages becomes more of a guessing game and an exercise in futility. Never fear though. The market moves from cycles of inactivity to cycles of fast and furious activity.

Monday, August 15, 2005

Options Week Starts out Tepid

A couple of times last week we have brought up the fact that trading conditions are poor and that opening a new position under current conditions is inherently too risky at this time. Today conditions are as poor as ever. We continue to believe that shorts are at risk of getting squeezed while the market trades sideways or makes another attempt at recent highs. Longs risk false breakouts. Conditions right now are ripe for brokerage houses as commissions get churned, they are ripe for options sellers who look to profit as contracts expire worthless, and they are terrible for the rest of us. Hopefully a bias will work itself out one way or the other this week. There is at very least a strong potential that such a bias will present itself in gold and energy stocks. Energy could go either way here. We could see it undergo serious profit taking or we could see another explosive leg up.

Friday, August 12, 2005

Market Remains Flat

Risk remains high in the broader market and we continue to watch for a bear flag to develop followed by a leg down to support on the S&P 500 and the NASDAQ. The Dow looks to be basing at support and could surprise, quite possibly due to some of its energy stocks. We would love to be proven wrong and have the market turn higher here, but with oil continuing to push to new highs and with options expiration week next week, we are fairly confident that the market will trade sideways and then shake lower to rid it self of the last of the weak hands before it once again reverses. There were some momentum plays that came up in our scans today, so sell pressures are not heavy here. We would most likely characterize this market as having a lack of buying pressure as opposed to it undergoing smart money distribution, which was the case back in January.

Wednesday, August 10, 2005

Waiting Out the Correcting in Gold and Oil

Gold and oil continue to be the only truly viable up trends at this time. Going long in the broader market is most likely going to end up in frustration as the indices consolidate and grind lower. We believe that the second shoe will drop after losses are consolidated. This should take place over the next few weeks. After which we should have a very nice buying opportunity in place. The most likely scenario to play out will be an ABC correction in the broader market similar to that which took place in June. Take a look at the QQQQ chart below. We are projecting a “B” consolidation leg to form over the next week to week and a half. After which the second and final leg down should take the market back to support where a very nice buying opportunity should be at hand.

Tuesday, August 09, 2005

Waiting is the Best Strategy

It is too early to start thinking about buying the dips as the market works out a bottom. Even so, the indices and stocks alike are nearing near term oversold conditions and the put call ratio is nearing almost 2:1 puts to calls indicating an overly bearish sentiment reading. Contrarians consider readings as extreme as this an indication that a bottom or turn around is near. The sixty dollar question is will the reversal be tradable or will it be a weak countertrend rally that should be used to short into? At this point we don’t know. We will need to watch the volume on the reversal to determine if smart money is starting to move back in. If they don’t, it likely means that the countertrend rally is only luring in retail investors before the next leg down ensues. Gold is getting choppy as the dollar finds itself in its own countertrend rally. The dollar reversal does in fact appear to be a weak rally that is only letting off downside pressure before another leg down can take place. We expect gold to chop around and pretty much trade sideways while traders position themselves in the dollar for the next leg lower. Recently, when the dollar goes lower, gold will move higher. Oil does not appear to be done moving up yet and looks like it could potentially grind its way higher over the next week or two. Waiting another day or two for better conditions is by far the superior trading strategy at this point.

Friday, August 05, 2005

Until Further Notice, Stick with Gold and Oil

Yesterday's trading projects a correction in the broad market. So far however indicators on all counts are strong so unless that changes the correction should occur with a number of nice bullish divergences and should prove to not be a harsh correction. It’s early yet to predict. Gold stocks consolidated high yesterday and look to work on establishing a base of support for a higher move. We would prefer this to a quick and fast run up since such a run would only entice sellers to get aggressive. Slow and steady is our hope. Meanwhile, Thursday's oil weakness was just a minor setback in the trend it would appear. The XOI experienced another flat day, but several oil related stocks, including ENI, showed renewed strength. Going into the weekend here we suggest staying in the safe haven commodities; gold and oil.

Thursday, August 04, 2005

Gold Miners Breakout

Gold broke out firmly and on volume on the back of a weak dollar yesterday. Take a look at the XAU index below. The trend line represents the 5-year trend, which was temporarily breached. The breakout yesterday puts the price of gold mining stocks above the basing inverted head and shoulders-type pattern that had been formulating just above the long term trend. The two year correction that gold had been in may now be at its end and the next leg up has a very good chance of starting from this level.

Wednesday, August 03, 2005

Oil Up, the Market is Up

The semiconductor sector broke through its trading range into a higher high yesterday. Meanwhile energy is still heating up and taking gas and oil stocks higher. The broader market is overbought and risk is high at this stage but it’s awfully difficult to argue with progress. Breadth in the broader market was strong yesterday and volume on the rally was strong so we don’t think anyone can argue that this was a retail rally in which smart money did not participate. At this stage we will have to assume the uncomfortable position that we just don’t know what will occur next. If the semiconductor breakout was the real thing, there will still be time to get in tomorrow or the next day. Likewise, it will pull along trailing sectors which will start to build good breakout patterns as more money comes into the market. If the high price of oil scares the market back into “reality,” whatever that is, then waiting for confirmation will pay off to since less risk exposure will be assumed waiting on the sidelines.

Tuesday, August 02, 2005

Oil Ramps Higher

Oil prices are once again ramping up and as yet are showing no sign of letting up. It won’t find chart resistance until it hits close to the unthinkable price of $70 per barrel. This is reflected in the oil service stocks. The XOI index has been consolidating above its pivot point and is now poised to make a run for its upper resistance channel which beckons like a magnet.