Thursday, June 30, 2005
Strength in Some Sectors
While the market appears to be stuck in a trading range as we near the holiday weekend biotechs saw a strong burst of buying interest yesterday after a number of stocks which had been under accumulation started to make their moves. Likewise, mining stocks, which have been up against resistance, pushed through resistance levels in a burst of volume.
Wednesday, June 29, 2005
Support Found
 The indices bounced off support provided by the right shoulder of the inverted head and shoulders pattern we noted on Monday. If the pattern holds true, we could be in for a few weeks of consolidation action as the QQQQ bounces between $37 and $38. Such consolidation will go a long way in healing some of the long term chart damage caused by the recent harsh pullback. The fact that selling in the general market has now subsided has caused some high flying stocks to resume their course. It is yet unclear how far buyers are willing to take them, but we suspect we may be in for some range trading over the next few weeks.
Tuesday, June 28, 2005
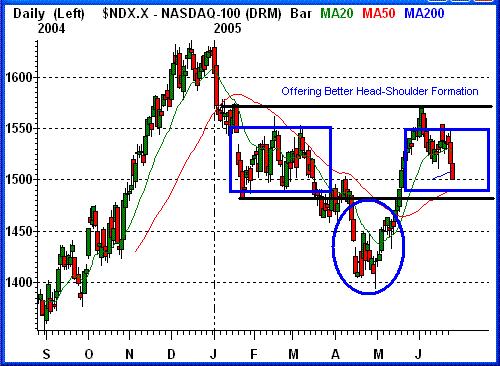
Bullish Head and Shoulders Forming
We found an interesting chart of the NASDAQ 100 (QQQQ) today which we believe has merit. It reveals the formation of a nice inverted head and shoulders pattern, which when/if complete would lead to a protracted rise in price. This would fit in nicely with the T-Theory which we presented here a few weeks ago. To briefly summarize, the T-Theory predicts a market rise into spring of the year 2006.
Monday, June 27, 2005
Friday's Russell 3000 Shuffle Causes Mixed Signals
The large volume that came in at the end of the day Friday was due to a reshuffling of the Russell 3000 index. Unfortunately this one time event skewed the results of our scans making it impossible to determine which volume represents continued buying or selling interest and which volume represents only a one-time event. We work heavily with probabilities but we do not guess. To open a new trade off of Friday’s charts would require us to make a guess and that we cannot do.
Meanwhile, while the market did follow through from Thursday’s selling confirming the downtrend, we also face end of the month window dressing. Selling pressures are likely to give way to buying later this week as retirement money and window dressing monies move into the market as they do every month at about this time. In other words, the bears may be in control as of Friday, but there is no guarantee they will retain their hold, at least not over the next week to week and a half.
Friday, June 24, 2005
Last Shake or the Start of Something Ugly?
Fortunately today’s scans didn’t reveal quite the same ugly picture projected by the indices yesterday. The Dow plunged 166 points making for quite a dramatic shake down, but unless the market follows through with more selling there doesn’t appear to be a reason to panic. We must, however, see the QQQQ hold support at $35.00-$35.25. This area represents its 50- and 200-day averages. If it fails there, it will likely get pretty ugly over the next 4 or 5 weeks.
The good news is we didn’t find any strong short set ups in our analysis today and we actually did come across some nice individual stocks showing some strength. In other words, selling pressure is not yet reaching the level where it is indiscriminately taking everything down with it. Hopefully we are only seeing the final shake out that loosens the weak hands before the market resumes the uptrend.
Thursday, June 23, 2005
Traders Being Lulled to Sleep
Major indices continue to remain above their 20-day averages and we are not seeing any bearish divergences showing up on major indicators warning us that the market rally is done yet. At the same time, stocks have been stuck this week lulling traders to sleep. Weeks like this make it hard to make money in the market. Trading can be one of the most exciting and challenging careers one can embark on but at times it can also be most boring and mind numbing. Fortunately the market has a history of moving from phases of inactivity to bursts of activity. This time will be no different. Without warning the market will make a move and the move is likely to be a strong one. There is of course no guarantee which direction the move will take, but for now we lean towards an upside move for the reasons stated above.
Wednesday, June 22, 2005
Strength Returning
We were pleasantly surprised to find underpinnings of strength in scans today after yesterday’s lackluster performance of the market indices. Selling pressures appear to be out of the way and stocks are starting to drift higher as the path of least resistance continues to be on the upside.
Tuesday, June 21, 2005
Oil Prices Playing Havoc
Stocks are stuck between a rock and a hard place here. A lot of momentum was lost last week during options expiration and so far momentum has not returned. It is important to trade what the market is doing right now, not what we expect the market should be doing. Right now it is not doing much. Scans revealed a fairly ugly picture today. Stocks are getting sold at resistance instead of breaking out and stocks are not rallying off their bases. Of course we know the culprit here. Oil, our old nemesis, is back near $60.
We expect oil to provide stocks with some relief as the over extended price of oil pulls back from its highs. Until this happens though, the outcome of any new trades can be fairly predictable. Stocks will get sold at resistance and they will fail to rally off of support. This leaves us with few really good choices. Shorting a market that is not breaking down is a recipe for whipsaw failure and opening new longs will lead to a slow bleeding of precious trading account dollars. We urge patience here. In a day or two oil prices will most likely come under pressure and end of the month window dressing is almost upon us. These two factors will lead to much better set ups than we have after Monday’s weak session.
Monday, June 20, 2005
Options Week Now in Rear View Mirror
With quadruple witching options expiration day now behind us we can start to focus on the general intermediate term direction of the market once again. We can now step back from the defensive mode we were in last week and start to look to position ourselves to benefit from the next market move.
Pulling back to look at the weekly chart views for both the SPY (S&P 500 ETF) and QQQQ (NASDAQ 100 ETF) we can get a better feel for the longer term direction of the market. Are buyers stepping back while professionals use the current high prices as a profit taking opportunity, or are stocks still being accumulated and thus being pushed higher?
The SPY, as you can see, has reestablished its uptrend started last August and is just a few points shy of following the midcap index to a new all time high. At this time there are no technical warnings or divergences to be concerned with. Money flow continues to reach up to new highs and volume has been steady. The QQQQ, while still a way from making a new high, has established a base above its 20-week average and is showing some nice support at its current levels. This base should help it maintain a steady and stable climb as the market continues to climb its wall of worry. There is plenty to worry about, including high oil prices, but remember, it’s not the news that matters, but how the market reacts to the news.
Thursday, June 16, 2005
Now is the Perfect Time to Get Fully Invested
For the past week and a half we have discussed the 20-day average test that major indices were undergoing. Focusing primarily on tech, since it (along with the mid caps) have led this rally, we can now clearly see that the testing of the 20-day average has been accomplished with successful results. Right here and right now is where the pros will make their bets. Everyone waiting for a pullback for a good entry point in the trend will not find a better opportunity than we have right now. The QQQQ, after consolidating gains at its 20-day average, dipped below yesterday only to find a late day rally where buyers stepped up to the plate and bought shares with conviction. Note both the complimentary volume and histogram buy signal that accompanied yesterday’s high volume mid day reversal. If a new leg up is in fact the destiny of the market then this is where it will start.
Wednesday, June 15, 2005
Mid Cap Stocks Pull Out in Front
After the SMH broke below its trading range yesterday we were a little worried about the message this was sending regarding the intermediate term outlook for the market in general. This is because the chip sector led the rally over the past six weeks. What we failed to notice was the fact that the mid caps have continued to rally and the S&P 400 mid cap index made an all time high at yesterday’s close. It was the small and mid cap stocks that led the market off the bottom in 2002 and the fact that they are running again can is a good sign. Scans today reflected this strength and we pulled up a number of mid cap stocks rallying on nice volume.
Tuesday, June 14, 2005
Risk is High This week
We have been beating the subject to death over the past week, but unfortunately the theme has not yet changed; until the QQQQ turns the corner and until the S&P breaks its trading range, there is really very little that we can do but wait. Of course there will be stocks that move this week, despite the fact that Friday is triple witching day. Separating the good from the bad is the hard part in a flat market. We continue to expect a bullish outcome to this deadlock but until we are proved right or wrong risk will be high.
Monday, June 13, 2005
Friday's Weakness Leaves Questions
After the lack of follow through from Thursday’s strong showing we are now in market neutral territory. We find few advantages on either side here. The SMH (semiconductors) closed with a doji just above weekly support for the second week in a row, essentially keeping its cards to itself. If it continues to base at the current level it increases the chance that it will make a break higher but its position is precarious at the moment. Other major indices could really go any way at this point as well. The longer term bias is still bullish, but short term anything could happen here. With triple witching options day fast approaching we expect a tight trading range where prices run in place most of the week.
Friday, June 10, 2005
Support Test Success
We are very tempted to become bullishly, if not irrationally, exuberant after yesterday's strong showing. The QQQQ bounced of the 20-day average provided in this morning’s report – note that it actually traded higher than Wednesday's highest price, turning the corner. At the same time the SMH broke out to a new high, crossing over the heavily defended $35 mark after failing to follow through on its first attempt. All eyes are now on INTC to see if it will give bulls a boost with strong earnings. The charts don’t lie, but they need follow through before the word “irrational” can be deleted letting exuberance stand alone.
Thursday, June 09, 2005
Important Support Test
The QQQQ touched its 20-day average and showed a small level of support there. If buyers remain as committed as they have been over the past month it could find support at this level and continue higher. Under such a scenario we would expect to see an early dip tomorrow and then a strong close. If however buyers are more exhausted we would expect to see the 20-day average support fail setting up a test of the 50-day where support, at least initially, should be strong.
Wednesday, June 08, 2005
Decision Point
Markets can't go straight up, and those that do eventually pay a price for their impudence. Reversals and pullbacks can be very painful, especially when they are as dramatic as we saw yesterday. This may just be corrective action that will help shake out excess and allow us to build support again for further action.
Also keep in mind that intraday reversals of this type represent textbook topping action. Before we go down that road though, we need further downside action in order to confirm a top is in. Specifically we would need to see indices slice through their 50-day averages. One big, ugly reversal day is not sufficient to conclude that we have seen the top.
Monday, June 06, 2005
Sector Rotation
So far the market retracement has been mild. It’s early to say it has found a bottom and is ready to run again but we are seeing some signs of rotation taking place that look promising. We need some time to drill down to the stocks themselves, but we saw some nice action in health and utilities and tech seems to be basing well. The S&P has run into resistance at its broken trend, but if you look at the SPY (underlying ETF) a completely different picture shows up. The SPY has recovered its broken trend and has been basing nicely on the old trend line. Overall the picture remains neutral with bullish promise.
Friday, June 03, 2005
Bulls Finding a Higher Level of Support
The SMH broke over $35 like we were looking for. This likely means that the market will go up for another few days before it pulls back to new, higher support levels. This breakout gives us a new base to work from and provides added evidence that this rally has legs.
Thursday, June 02, 2005
Watching the Semiconductors
Technology may be gearing up to lead another leg higher after the Fed hinted it was done raising rates. The QQQQ is well over extended, but the S&P has plenty of new support after reestablishing its uptrend. The most interesting development is the semiconductors, which have been market leaders over the past month. The SMH (semiconductor holders ETF) is back at $35, where it has been rejected twice since last year. This time however, it is attempting to break $35 with the wind at its back now that the 2-year downtrend is behind it. Money flow on the weekly chart has already broken out so we will soon find out if this is a precursor to a price breakout. Since we see very little evidence of distribution at current levels, we are optimistic.
Subscribe to:
Posts (Atom)