Securities Research Services

Friday, February 29, 2008

Trend Hangs Vicariously on S&P 1,360

The market's near term uptrend sputtered yesterday. In actuality, it never showed a great deal of strength to begin with.

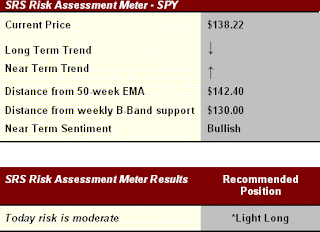
Nevertheless we can't call this a roll over yet. The SPY closed right above support yesterday. If the S&P 500 moves below $1,360 we are looking at a retest of the lows and it would be best to close all long positions in all groups other than gold and oil. If it holds here then the rally back to the 50-week average is still in play.

Outlook:

The outlook has switched back to neutral. Everything is dependent on whether the S&P can hold $1,360.

*Stick to inflationary sectors such as oil and metals.

Thursday, February 28, 2008

Watching and Waiting

No major changes to the risk table today. We continue to look for higher prices into the end of the month and for the first few days next month.

Outlook:

The SPY followed through yesterday while the QQQQ remains stuck below resistance. We continue to look for meaningful follow through. That said, the market's near term trend is up and pullbacks should be buying opportunities until the SPY tags overhead resistance at its 50-week average.

*Stick to inflationary sectors such as oil and metals.

Wednesday, February 27, 2008

Gold Breaks Out On Weak Dollar

The Euro broke out in a big way yesterday, and gold responded in kind. Inflation is a big driving force in the commodities sectors and a strong bull market in those sectors is once again reasserting itself.

Jesse Livermore once remarked that his biggest mistake was becoming bearish on the entire market when 2-3 sectors were broken down. This is a good lesson to pay attention to here. While the broad market is in a confirmed bear market, the oils, metals, and ag are all in strong up trends and there is no sign that these trends will let up any time soon.

While the SPY is in a slightly bullish up tick, it gives the bull market in commodities virtually no headwind to fly into.

:
:
Outlook:

The SPY followed through yesterday while the QQQQ remains stuck below resistance. We continue to look for meaningful follow through. That said, the market's near term trend is up and pullbacks should be buying opportunities until the SPY tags overhead resistance at its 50-week average.

*Stick to inflationary sectors such as oil and metals.

Tuesday, February 26, 2008

SPY Breaks Higher: Looking For Follow Through

The SPY broke free from its range yesterday, but continues to have resistance at the $137.50 level. If it can follow through higher, it should be free to run to $142-$143.50, giving the bullish set ups we are finding a good boost.

:
:
Outlook:

The SPY broke free of its pennant consolidation area yesterday. However, with the daily swings that we have seen in this market, we need a follow through day before we can get too excited about the rally prospects. Nevertheless, things are shaping up for a rally.

Monday, February 25, 2008

Market May Be Ready To Break Higher

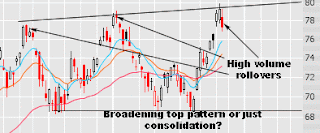
The trading range we are now in has been one of the most persistent we have seen in several months. On Friday prices broke through lower support, but the effort on the part of the sellers was weak at best as volume levels remained low throughout the day. Then, during the last 1/2 hour, prices spiked back up into the range on high volume.

We have to give the win to the bulls on Friday for averting a breakdown and for the strong volume into the close.

The trend remains transitional but we have adjusted our position to light long due to the increasingly high probabilities that this market will experience a strong short squeeze due to all the failed break downs recently. Short traders are getting frustrated and if the market can break higher, there should be a lot of short covering fuel to power the market sharply higher.

Add to that, we should see new money come into the market, which always happens at the end of the month when funds receive capital inflows from 401k plans, et al.

:
:
Outlook:

The current outlook now depends on the direction the continuation triangle pattern breaks. If it breaks to the upside, then we expect prices to rally into the falling 50-week average for a high probability shorting opportunity. If prices break lower, prices may retest January lows for a high probability buying opportunity.

Friday, February 22, 2008

Oil Rolling Over

The market's trading range continues.

Everyone surely sees the pennant formation that the S&P is trading in and as such, everyone is waiting to trade the breakout or breakdown of this pattern. Keep in mind that when everyone is looking at the same pattern, that pattern has a high probability of not working out the way everyone expects it to. It's best to avoid making guesses here and just react once the market shows its hand.

Meanwhile, oil rolled over on heavy volume after once again testing overhead resistance. A trip back to support looks likely here. And, with oil stocks continuing to diverge negatively against the price of oil, shorting the group looks like a good strategy while this market waits to make up its mind.

Outlook:

The current outlook now depends on the direction the continuation triangle pattern breaks. If it breaks to the upside, then we expect prices to rally into the falling 50-week average for a high probability shorting opportunity. If prices break lower, prices may retest January lows for a high probability buying opportunity.

*Until the market breaks one way or the other, a cash position is preferable. However, we see good shorting set ups in the oil sector right now and long positions that have been working well, continue to look good, so if you pick and choose there are some potential long side plays as well.

Thursday, February 21, 2008

What Refuses To Go Down Will Probably Go Up

Yesterday's refusal to go down in the face of bad news (inflationary CPI figures) indicates that this is a market that wants to go higher.

The stalemate on the SPY broke down at the open, but then proceeded to trade higher throughout the day, keeping prices well within the current trading range.

Even so, we are much more bullish on the market's outlook following yesterday's action for two reasons. First, as already mentioned, the market refused to break down when it had a valid reason to do so. Second, a large number of stocks are behaving quite bullishly. Most are inflationary stocks, like oil and metals, but good behavior is good behavior and it's something that we haven't seen for quite a few months now.

This doesn't mean go out and buy everything in sight. Rather, be choosy and carefully buy pullbacks in the strongest sectors, including metals, Ag, oil exploration and a handful of other sectors that are working in this environment.

Later today, if we get the chance, we will highlight one or two strong sectors here in this blog.

Outlook:

The current outlook now depends on the direction the continuation triangle pattern breaks. If it breaks to the upside, then we expect prices to rally into the falling 50-week average for a high probability shorting opportunity. If prices break lower, prices may retest January lows for a high probability buying opportunity.

Wednesday, February 20, 2008

Stalemate Likely To Resolve Itself Today

All eyes are on the contracting triangle pattern that has developed over the past couple of weeks. Until this pattern breaks, and probabilities are high it will be today, we will have a better idea what to look for over the next few weeks.

If prices break to the upside, then we may finally get the rally back up to the falling 50-day average we have been looking for. If it breaks lower, then look for a test of $131.50 and then possibly $126.

The intermediate and long term trend is down, so probabilities favor a downside breakdown. Upside breakouts should be looked at suspiciously until the price holds for more than an hour or two. An early break higher may get faded. A breakdown could also get faded, but the likelihood is much lower due to the fact the market is in a downtrend.

:
:
Outlook:

The current outlook now depends on the direction the continuation triangle pattern breaks. If it breaks to the upside, then we expect prices to rally into the falling 50-week average for a high probability shorting opportunity. If prices break lower, prices may retest January lows for a high probability buying opportunity.

Tuesday, February 19, 2008

A Chemical Romance

The chemical sector continues its interesting journey, all but ignoring bear market pressures that took down even the strongest of groups. Now, once again, these stocks are back at 52-week highs and knocking on the door of resistance like a DEA agent with a warrant in hand knocks on the door of a suspect.

Today we will take a look at some of the leading stocks in this sector, we'll look to see if there are any chinks in the armor of the massive uptrend they are enjoying and look at a couple of scenarios that might play out over coming weeks.

Starting with Celanese Corp (Ticker Symbol: CE), note that the stock has formed a strong base of support above its rising 10-day average. After a short trip below the 200-day average, the stock has recovered in V-bottom fashion and the 50-day and the 20-day are rounding back up again.

Major resistance hovers just above in the $42.00 area so the stock may stay hemmed in for a while, but the bullish outlook for this stock continues to be promising.

Next, we will take a look at Monsanto Co (Ticker Symbol: MON). MON broke its trend when the market plunged in January, but has since recovered strongly and is now testing the underside of the uptrend. It too may be hemmed in for a while in this area, but the trend for MON is such that it would be foolish to short hoping to catch the top here.

:
:
We would look for one of two scenarios to unravel here. If the market can power higher from current prices, look for MON to test and probably take out its 52-week highs. If, however, the market moves back to January lows for a retest, MON may tread water or pull back slightly for a period of time.

Finally, let's take a look at MOS. Today MOS is breaking out to a fresh 52-week high on volume. Unlike CE and MON, MOS never breached its trend on a closing basis. Undoubtedly this is a strong stock as can be seen from the weekly view below.

There is one chink in the armor that we would point out. Money stream (the pink line in the chart below) has diverged bearishly against price. This isn't a deal breaker and we've seen a divergence like this heal itself. It does tell us that the stock has a bit of a cough and if it doesn't take care a cough could potentially turn into something worse like a case of pneumonia. There is no reason to sell here and no reason to panic. Just be aware that signs of weakness are starting to show up. As long as more symptoms don't appear it should be ok.

Stocks Remain Range Bound

The SPY, and all other major indices, continue to trade below all major moving averages. On Thursday prices threatened to roll over out of the near term uptrend and in fact they did on Friday. Selling on Friday wasn't spectacular, however, and the selling was quickly contained. We would consider the day essentially a draw between sellers and buyers.

Technically the market is projecting a retest of January's lows. Technically traders should be short here.

That said, we aren't sure that the message sent by the technicals is reliable here. European markets rallied hard yesterday while US markets were closed. It remains to be seen whether the US market will follow today.

The bottom line is that the market remains range bound. There are two key areas to watch on the SPY. A close above $136 would break overhead resistance and would project a run up to $142+. A move below $131.50 would be a breakdown and would project a retest of the lows.

We would be strong buyers if the price were to move back into the $126-$129 area again. Such a move would constitute a low risk buying opportunity.

:
:
Outlook:

The rebound rally back up to the 40- and 50-week averages we have been discussing will likely occur sooner rather than later. Until prices regress back to their mean, risk of whip saw will remain high and position sizes should be kept small.

Friday, February 15, 2008

Bearish Engulfing Candlesticks Abound

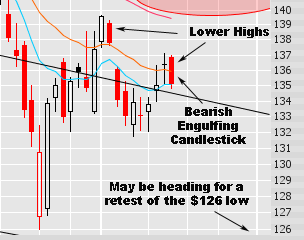
Yesterday the market, represented by the SPY chart below, sold off at resistance creating a lower high and a bearish engulfing sell signal.

This sell signal was repeated en masse on stocks across virtually all market sectors.

:
:
Explanation:

Near term sentiment isn't bullish enough to provide support and with yesterday's sell signals the market may be headed for a retest of January lows again. While we continue to look for a run back up to test the 50-week average, we can't ignore the weakness that exists on the daily chart view. A sell signal is a sell signal so it makes sense to take a short position here as long as good tight stops are used should this just be another market misdirection. Risk remains high, so keep your exposure to a minimum.

Outlook:

The rebound rally back up to the 40- and 50-week averages we have been discussing will likely occur sooner rather than later. Until prices regress back to their mean, risk of whip saw will remain high and position sizes should be kept small.

Thursday, February 14, 2008

It's Best To Wait For A Dip

Prices rose yesterday but volume was muted. If you were smart enough to buy the SPY in the 132-133 area, then continue to hold. Otherwise, there are just no advantages today, this Thursday in front of tomorrow's options expiration.

Near term sentiment has turned bullish, so a dip that threatens to retest recent lows is likely. Considering the fact that long term sentiment is extremely bearish, buying the next dip would be the wise move. Today the wise move is to sit on one's hands and wait for the dip.

:
:
Explanation:

Near term sentiment flipped back to bullish yesterday. However, volume on the upswing was weak across the board. Prices could theoretically keep moving higher without a pullback, but the odds support a strong likelihood that prices will pull back and build a better base before a true rally gets underway.

Outlook:

The rebound rally back up to the 40- and 50-week averages we have been discussing will likely occur sooner rather than later. Until prices regress back to their mean, risk of whip saw will remain high and position sizes should be kept small.

Wednesday, February 13, 2008

Overly Bearish Market Supports Higher Index Prices

Scans today offered up mostly short positions. The QQQQ is just plain ugly here as are stocks like AAPL. Oil stocks are in a dead cat bounce that looks to have run its course.

Even so, the near term trend in the SPY is up and sentiment is overly bearish. This supports a blue chip rally at a minimum.

:
:
Explanation:

Bearish sentiment supports a rally here. However, weaker sectors, such as tech and oils, offer potential shorts here. Either way, we recommend shorting only a very small position and if you go long, try to stick to index trades as individual stocks are unreliable here.

Outlook:

The rebound rally back up to the 40- and 50-week averages we have been discussing will likely occur sooner rather than later. Until prices regress back to their mean, risk of whip saw will remain high and position sizes should be kept small.

Tuesday, February 12, 2008

It's To Your Advantage To Heed Risk

Today we would like to address the reasons why risk is such an important consideration to take before putting money to work in the market and where the advantages are best.

Over the past few weeks we have noted that risk has been extremely high. This has been represented in the SRS Risk Assessment Meter. But today, let's take a look at precisely why risk is high and why it is not a good idea to have much, if any cash working in this market. We will also take a look at what a low risk situation looks like and why putting cash to work has a better chance of success when risk is lower than it is now.

As you can see on the chart below, the SPY, which we are using as a representative of the broader market, is currently trading at its pivot point:

After putting in a panic low in late January, the market has pulled back to the pivot point where it is struggling to make a higher low. Due to the fact that sentiment is extremely overly bearish and due to the fact that technical indicators point to a low level of buying here, not to mention the fact that the Fed continues to be a factor, odds slightly favor a move back up to the falling 50-week average.

The key word here is "slightly."

Buying is extremely weak at current levels and volume has been shrinking. While odds slightly favor a rally back up to strong resistance, a breakdown below last week's lows has some potential as well.

If the market can muster a rally, the number of stocks that will come along for the ride is likely to be small since the market is in a major downtrend here and any upside would only be a dead cat bounce against the larger trend. As such, trades taken in this area are prone to a high failure rate.

Where Risk Is Low:

One of two things will happen over the next week or two, which will give us a better trading opportunity than currently exists. The market will either break down and give us a good low risk buy entry as panic spikes once again, or the market will weakly rally into overhead resistance, giving us a high risk shorting opportunity.

The lesson here is that if you refuse to put good money to work during times of high risk and patiently wait for prices to move into the zones where risk is much lower you will not only avoid letting your trading account get chewed up by too many stop outs, but you will easily outperform the averages and more than likely blow away the star fund managers who feel obligated to have their money working in the market at all times.

Independent Trader Advantages:

As small, independent traders, you have an advantage over the big money managers in that you don't have to have your money working during times of high risk and you have the ability to move in and out of positions quickly as conditions change. This is an outstanding advantage that most traders fail to use. We strongly urge that you use this advantage as doing so can make the difference between below average returns or results that would make a Buffet proud.

Explanation:
:
:


With sentiment bearish and with prices near support levels, we are looking for stocks to rally back up from near current levels. As noted above, it's hard to justify buying when all major moving averages are still pointed down, but we wouldn't want to be very short here either. In fact, it might be a good idea to put a toe or two in the water (using tight stops of course) here in some of the stronger areas of the market.

Outlook:

The rebound rally back up to the 40- and 50-week averages we have been discussing will likely occur sooner rather than later. Until prices regress back to their mean, risk of whip saw will remain high and position sizes should be kept small.

Monday, February 11, 2008

A Tradable Bottom May Be In Place - But Be Careful

The QQQQ has now found support at its 5 year trend two weeks in a row. The SPY is trading a meager 1% from weekly Bollinger Band support. Bollinger Band support is unreliable when downward momentum is strong, but momentum has stabilized so we believe that this support level will hold here.

While technically prices are oversold and at levels where we would expect them to find support, talk of recession has reached near fever pitch in the media. People who have no experience in the markets and no viable knowledge about the economy are talking recession.

With bearish sentiment so high and with stocks at support we have to believe we are very near a tradable bottom. We can't justify jumping in and buying yet; not with the 5, 10, 20, 30, 50, and 200 day averages all trending down. But, we would certainly want to keep stops on shorts very tight and we would be putting together a wish list of stocks to buy when the market turns the corner and the 5- and 10-day average turn back up again.


:
:

We respect your privacy. And we hate spam as much as you do. Your details will not be sold or rented to anyone

Privacy Policy

Explanation:

With sentiment bearish and with prices near support levels, we are looking for stocks to rally back up from near current levels. As noted above, it's hard to justify buying when all major moving averages are still pointed down, but we wouldn't want to be very short here either. In fact, it might be a good idea to put a toe or two in the water (using tight stops of course) here in some of the stronger areas of the market.

Outlook:

The rebound rally back up to the 40- and 50-week averages we have been discussing will likely occur sooner rather than later. Until prices regress back to their mean, risk of whip saw will remain high and position sizes should be kept small.

Friday, February 08, 2008

On Day Up Does Not A Bottom Make

We warned that whipsaw risk remained high and yesterday we saw how this risk could come into play and murk up the situation.

Realistically there are few advantages in this market. It is oversold, but still trending down. Yesterday's high volume bounce was interesting, but it didn't break the downtrend. Moreover, scans today once again revealed very little to work with.

Right now short positions are risky as this oversold market has the potential to turn on a dime and squeeze shorts hard when sentiment turns overly bearish like it did yesterday following a poor CSCO earnings report. At the same time, until we get a follow through day to the upside and a better base to buy off, buying this market is even riskier than shorting it.

The only reasonable thing to do here is to stand aside and wait while big risk takers allow their accounts to get ground up in the day-to-day reversals.

Explanation:

Long term, the market is in a confirmed downtrend.

The market is getting jumpy and is likely close to a tradable bottom. But, until we get a follow through day, this market should be considered guilty until proven innocent.

Outlook:

Prices may test recent lows; especially in tech. However, we continue to look for a rebound rally back up to the 40- and 50-week averages at some point over the next few weeks. Until prices regress back to their mean, risk of whip saw will remain high and position sizes should be kept small.

Thursday, February 07, 2008

QQQQ Tests Its 5-Year Trend Today

The QQQQ is threatening its 5-year trend line. It could potentially break here but it's not a good idea to press short positions until there is a confirmed break down. If the QQQQ breaks down, there is always a possibility that the Fed will jump in with another rate cut.

Today we recommend tightening up short stops. Likewise, if we get a panic sell off this week and the SPY moves down to 125, it might be a good idea to fade the dip by buying fear in the banks, real estate, builders, retail and perhaps even the semiconductors; all of which are vulnerable to more short squeezes.

On the other hand, if prices continue to just bleed lower, like they have for the past two days, this decline can continue unabated for some time to come.

More importantly, keep position sizes small, be quick to admit if you are wrong, and keep a good cash reserve that you can put to work when risk levels decrease.

Game plan summarized: Stay short, keep stops above your entry points, and if the market panics and washes out, consider buying small positions into the panic. A wash out would constitute a quick SPY move down to $125.
:
:


Explanation:

Long term, the market is in a confirmed downtrend.

The near term trend turned lower once again yesterday. However, note that sentiment has once again moved into the overly bearish area.

Due to the fact that there are several levels of support currently being tested, risk of a short squeeze reversal is high. Likewise, the Fed continues to be a factor. If the market threatens to plunge again, they may be ready to throw in another big rate cut.

Outlook:

Prices may test recent lows; especially in tech. However, we continue to look for a rebound rally back up to the 40- and 50-week averages at some point over the next few weeks. Until prices regress back to their mean, risk of whip saw will remain high and position sizes should be kept small.

Wednesday, February 06, 2008

Market Turns Down Again, But Shorts Should Remain Cautious

We would remain mostly in cash here. Oils and some big cap tech offer compelling short set ups, but potential for whipsaws and short squeezes remain high; especially in the financial and builders sectors, which benefit from recent rate cuts.

Explanation:

Long term, the market is in a confirmed downtrend.

The near term trend turned lower once again yesterday. However, note that sentiment has once again moved into the overly bearish area. Likewise, volume was not spectacular so shorts that press may end up getting squeezed on a mid day reversal again.

There are some areas that offer decent short set ups, but we recommend keeping position sizes small and be ready to exit quickly if prices once again find support.

Outlook:

Prices may test recent lows; especially in tech. However, we continue to look for a rebound rally back up to the 40- and 50-week averages at some point over the next few weeks. Until prices regress back to their mean, risk of whip saw will remain high and position sizes should be kept small.

Tuesday, February 05, 2008

Whipsaw Risk Remains High

Yesterday we wrote that the potential for a pullback in the near term uptrend was high. Indeed, the market began a pullback, while volume levels decreased. Decreasing volume during the pullback favors the argument that the near term trend remains up.

Scans today revealed little to work with. Tech stocks look extremely weak here, but they remain oversold on their weekly levels and risk of whipsaw if you force a short in this sector is high.

Banking stocks may offer us a quick long trade if they continue to pull back in an orderly fashion (meaning that volume continues to rescind with the price).

The only change to the Risk Assessment Meter today was that sentiment moved from overly bullish back to neutral. This to favors the argument that we are experiencing merely a pullback in the near term uptrend.

If we can get a deep sell off today, we may be able to buy into the fear. Otherwise, prices may need at least another day or two to consolidate and pull back before it is safe to buy.

Explanation:

Long term, the market is in a confirmed downtrend. However, the near term trend is now up. Following the failure of Wednesday's sell signal the probabilities are now high that the price will return to the 40- and 50-week moving averages, giving the near term trend a price target of $143-$143.50.

Near term the price is currently extended a large distance from lower weekly Bollinger Band support without a pullback. Likewise, near term sentiment readings have moved into dangerous, overly bullish territory.

Outlook:

Over the next few weeks the likelihood that prices will regress back to their, as measured by the 40- and 50-week averages is high, which means that traders should have a long side bias here. Before new long positions can be safely taken, however, prices need to pull back to work off near term over bought conditions.

Monday, February 04, 2008

Examining Sell Signal Failure: Part 1 of 3

This is an important post, which contains a lot of details, so we urge readers to take the time to review it thoroughly.

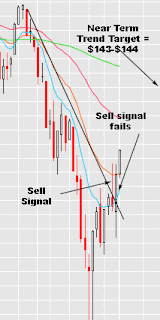
Last Wednesday, following the Fed rate cut, the market rallied and then sold off hard at resistance on heavy volume. This left a broad range of shooting star sell signals on all major indices and on a large number of stocks as well. It looked like the recent steep downtrend was set to resume.

But the sell signal failed on Thursday and shorts, including us, were trapped by a whipsaw.

Could the failure have been predicted? It's not clear. We know that we weren't the only ones reading the sell signal that day.

We wanted to get to the bottom of the failure and see if we could have predicted the failure, so we spent the entire weekend examining charts. What we discovered is that while the sell signal failure was not predictable, that clearly risk of sell signal failure was high.

We mentioned last week that we were struggling to adjust or recalibrate our strategies to the bear market that arguably started around October or November and confirmed last month. Extensive research over the weekend led to a bit of an epiphany in this area, which in turn led to the development of a simple set of criteria that can be used as a tool to quantify risk and ensure that we end up more often on the right side of the trade.

We will break today's post into several parts so that it can be digested in pieces. We have a lot of territory to cover, but we believe that readers will find the read well worth it as this has the potential to profoundly impact the success rates of each and every trade you take moving forward.

SRS Risk Assessment Meter

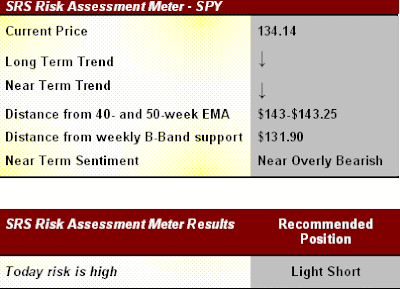
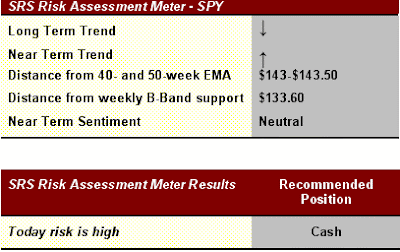
No one knows what the market will do tomorrow but it is clear that some days risk of failure is higher than other days. We have examined the charts and have now developed a way to quantify risk using a simple set of objective criteria. Note, it is important to keep criteria simple, otherwise interpretation of the factors may be too subjective.

We will use the SPY (S&P 500) as our benchmark.

Criteria are as follows:

1. Long term trend direction
2. Near term trend direction
3. Distance from 40- and 50-week EMA
4. Distance from weekly Bollinger Band support
5. Near term sentiment readings


From the results of these criteria we can then establish objectively A) whether we should be long or short, and B) how high risk of failure is.

From today, we plan to post the daily risk level and whether the long or the short side offers the best risk:reward.

The SRS Risk Assessment Meter will help us to determine whether it is best to be:

1. Heavy long
2. Light long
3. Stay in cash
4. Light short
5. Heavy short

Today's SRS Risk Assessment Meter Results

Explanation:

Long term, the market is in a confirmed downtrend. However, the near term trend is now up. Following the failure of Wednesday's sell signal the probabilities are now high that the price will return to the 40- and 50-week moving averages, giving the near term trend a price target of $143-$143.50.

Near term the price is currently extended a large distance from lower weekly Bollinger Band support without a pullback. Likewise, near term sentiment readings have moved into dangerous, overly bullish territory.

Outlook:

Over the next few weeks the likelihood that prices will regress back to their, as measured by the 40- and 50-week averages is high, which means that traders should have a long side bias here. Before new long positions can be safely taken, however, prices need to pull back to work off near term over bought conditions.

Two potential scenarios could unfold from here, prices may extend their run over coming days without a pullback, or prices could pull back in an orderly fashion.

If prices continue to extend, it is best to stay in cash as risk will remain extremely high. If, however, prices pull back starting early this week, we would look for a SPY pullback target of $133-$134. This would offer traders a chance to go lightly long for the run back to the 50-week average at $143.50.

Regression to the Mean

In this post we will take a look at some of our research for those interested in understanding how we developed the SRS Risk Assessment Meter.

Before we get started it is important to observe two simple observations about stocks and markets.

Observation 1: Markets sometimes trend
Observation 2: Prices tend to regress toward their mean

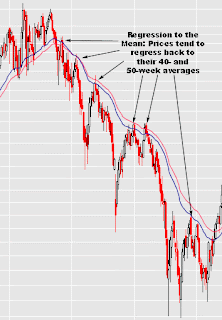
Above is a chart of the S&P 500 between the years 2000 and 2002 when stocks were last in a bear market. There are two important things to note about this price chart.

1. The long term trend was down, but within that downtrend many countertrend rallies took place
2. Every single countertrend rally regressed back to the 40- and or the 50-week moving averages except one.

If you pay attention, a lot can be learned from this chart.

Here are a few observations that can be made from the above S&P 500 chart:

1. Countertrend rallies are likely to return to the 40- and 50-week averages, giving them a clear price target.
2. When the price is at the 40- and 50-week average opening new short positions can be highly profitable and risk of failure is low.
3. When the price is too far below the mean (40- and 50-week) short trades become increasingly more risky to take and trailing stops on open short positions should be tightened.

Finding the Forest Amongst the Trees

Now let's take a look at the current SPY chart and see if we can't determine why last week's sell signal failed, trapping short positions.

Last week the SPY gave us a sell signal on the day of the Fed rate cut. That sell signal failed and prices rallied on Thursday and Friday last week as seen in the daily SPY chart below.

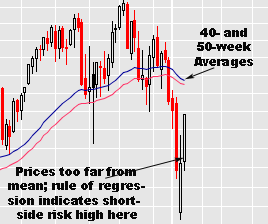
Could the sell signal failure above have been predicted? Maybe, maybe not. But if we take a look at the weekly SPY chart we can see that risk of failure was high.

Note above on the weekly SPY chart that prices had reverted a great distance from their mean as measured by the 40- and 50-week moving averages. Prices could certainly have continued to fall lower, but risk of going short was high as historically prices tend to regress back to their mean.

The failure of Wednesday's sell signal broke the near term downtrend. This signaled that a countertrend rally is now in effect. Since historically prices tend to tag their 40- and 50-week moving averages during countertrend rallies, probabilities are high that we will continue to see the market rally (with pullbacks of course) until it reaches back to its mean.

Bottom line: It's a good idea to go lightly long on pullbacks, looking to take profit and go short when the SPY reaches the $143-$143.50 area.