Securities Research Services

Friday, December 30, 2005

Never Short a Dull Market

Yesterday we mentioned a line in the sand where bulls had to make their stand with the QQQQ. Window dressers didn't show up once again and the QQQQ wasn't able to hold support. We don't wish to be ultra stubborn with our bullish stand here but even though the situation looks dire for the bulls there is something that needs to be considered. Going back to last month recall that window dressers did show up until the first day of December, or the third day into the traditional window. On December 1 the market gapped up and continued to run for several days after discouraged traders denied end of the month buying washed out November 29th and 30th. Consider that the market is very oversold here, that there have been no real distribution days aside from December 8, and the fact that end of the month buyers could potentially be waiting for market sentiment to turn a bit more bearish before they step in. Now if a series of real short set ups start showing up in our scans we will rethink our theory here but right now we think there is still potential for a sharp reversal. We hope that subscribers can see why we have hesitated to put money to work in the market as we wait for the market to make its move. The best immediate term indicator we have at our disposal is the health of our daily scans. All week scans have been telling us that buyers are just not stepping in yet. On the other side of the coin, they have not indicated that distribution has been taking place either. A few smart rules to live by: Don't short a boring market, don't short an oversold market if selling is occurring on light volume, and finally, don't short into the end of the month.

Thursday, December 29, 2005

Bulls Have the Setup, Will They Take Advantage?

If you drill down to the 40-day, 2-hour view on the QQQQ an interesting development is revealed. The price pulled back to the 200-period average and bounced early around the 19th/20th of the month. This week the price has once again pulled back to this moving average and yesterday the price bounced once again, this time with strong bullish divergences on most major indicators. There is a line in the sand drawn for the bulls here. The QQQQ must not go below $40.77 or the index will most likely drag back down to $39.50. That said, the set up for the bulls is clear and with end of the month window dressing upon us, odds vastly favor a strong move higher starting today. Such a move higher will produce reliable buy set ups.

Tuesday, December 27, 2005

Looking for Positive Bias to Continue

Last week ended with a slightly positive bias and with indices still oversold. Buyers need to step up here however or the correction that started in early December could persist into January.

Thursday, December 22, 2005

Signals are Mixed

The weak bounce yesterday was uninspiring and leaves much to be desired. It may be that that Santa rally turned out to be just a self fulfilling prophecy and not one that was led by legitimate end of the year factors such as fund mark ups. Making a bearish case it may be that traders sold early strength and we may find that the intermediate downtrend started this week will remain in effect until the QQQQ reaches its lower channel support as outlined in Tuesday's report. The bullish case, which we still believe has some merit, is that the market pulled back to intraday support with bullish divergences showing on various indicators and the late afternoon pullback is just another attempt to shake out weak longs before the real rally begins. Today should be interesting. (Hedging? Yes we are hedging. The signals are mixed here.)

Wednesday, December 21, 2005

Sellers Exhausted

The QQQQ stopped just above its 50-day average and left a doji yesterday. A doji represents a day of indecision. Considering that there is still a favorable seasonal bias even if the rally that everyone expected didn't arrive (perhaps in fact because everyone expected it) and considering the fact that indices have moved from overbought to very oversold we have to entertain the idea that the market has delivered a near term bottom. Yesterday we indicated that follow through from Monday's breakdown would have to ensue before any reliable short set ups would emerge. Follow through lower did not arrive and though buying opportunities are still thin we should see an upward bias into the end of the year.

Tuesday, December 20, 2005

Santa Stays Away

Santa may not arrive on Wall Street after all this year. Several important indices in the tech sector broke decisively below lower support levels. The S&P and Dow threaten to follow. Follow through is always important, but we may find that the market is offering some short swing trades this week. Keep in mind that a pull back here does not destroy the longer term outlook for a continuation of the strong bullish move begun in October. Taking a look at the QQQQ you will notice that after the weekly breakout in early November, the price has now been turned back by upper channel resistance. There are two points where the price can now find support, depending on how determined sellers are. Minor support can be found at the pivot point towards the center of the channel, roughly just below yesterday's close. More likely however the price will track back to the $40 area where the major trend is. The latter is a more likely scenario and one which should produce some intermediate shorting plays.

It's a rare thing to not experience the Santa rally, but as everyone should know by now, the market does experience anomalies and it is better to expect the unexpected than to rigidly hold onto your original bias.

Thursday, December 15, 2005

Dazed and Confused

Yesterday traders were frustrated as numerous breakouts from the day before failed and the tech sectors, which had been leading since October underperformed. Meanwhile, small caps represented by the Russell 2000 showed some life as the index touched a new high before pulling back slightly and the S&P 500 broke to a new high. It was a very mixed and frustrating day for a lot of people. Adding to the confusion is the fact that our scans over the past couple of days have been turning up virtually a handful of poor set ups. Today's scans were of even poorer quality and turned up nothing we would trust. Frankly we are hesitant to make any conclusions about what message these mixed signals are telling us. The last two weeks in the year are traditionally strong as funds try to gun their performance measures and expectations for a Santa rally causes people to come off the sidelines to participate creating a self-fulfilling prophecy. This year could of course be different as the market never guarantees anything, but we sure wouldn't bet against a year end run. Likewise, we never wish to force a trade when there are no clear advantages. Right now there are no clear advantages and we have little choice but to wait this out. It is very likely that other market participants are just as confused as we are right now and this confusion is causing the mixed readings we are seeing.

Wednesday, December 14, 2005

Watching for a Small Cap Breakout

The small caps didn't participate in yesterdays rally but there is a good chance this is about to change. The Russell 2000 is flirting with a break out into new 52-week highs so we may start to see money flowing into the quicker moving small caps as we head into the second half of the week. It is likely that the Fed release yesterday will be hashed over for a few days as analysts try and determine if they are done raising rates for now. The market so far has reacted quite positively to the release and there is at least a good chance that the Fed will take a break here to give the economy time to digest the latest round of rate hikes. Overall there doesn't seem to be anything in the report that threatens to derail this latest bull run so we should start to see the market climbing higher once again now that a base has been building over the past couple of weeks.

Tuesday, December 13, 2005

All Eyes on Fed Today

Today's Fed meeting is likely to set the tone for the rest of the year. All eyes will be scanning the Fed release for language indicating that rate hikes are near completion. Specifically the market has been expecting the word "measured" to be deleted from the report. This has been the word used by the Fed over past months that has been interpreted as hawkish on rate hikes by most analysts. As we approach the meeting today charts are set up for a run into the end of the year. The NASDAQ and S&P 500 are both trading with strong bull flags and are showing good divergences all around. A break up from these flags will be a buy signal and those who have remained doggedly short are essentially going to have no choice but to flip to the long side propelling prices even higher. The Fed report may or may not impact this set up. We just have to wait and see what they put out and how the market interprets it. Gold is most likely going to feel the most impact from the Fed today. If hawkish language is removed then we should see gold shares continue their rally. If not, then the sector weakness we have witnessed over the past couple of days will likely turn into something worse. Today is a really good day to stay sidelined waiting for the market to react to the Fed. If the broad market turns higher here we will have many new advantages so it makes sense to wait a day rather than try and force something to happen in front of the meeting.

Monday, December 12, 2005

Oversold Market Likely to Continue Assent

The NASDAQ 100 has pulled back to its 20-day average as money flow and other indicators continue to positively diverge. This indicates that accumulation has been taking place propping up the price. Meanwhile the SMH held where it had to and should move higher off of its breakout point. The market, which has been overbought recently, has now moved into oversold territory and positive price action and positive technicals favor a break higher as we move into the last couple weeks of 2005.

Friday, December 09, 2005

Bull Flag Fails, But Lower Support Holds So Far

The bull flag failure on the SMH yesterday is concerning. The price closed back at weekly break out support so it is very important that the SMH hold here if the health of the market's uptrend is to remain in tact. We are still reasonably confident that support will hold as underlying stocks look much better than the tech indices at this point. In fact gainers outnumbered losers yesterday even though indices traded in negative territory. Weakness in INTC most likely caused some to misread the direction of the broader market causing some fear based selling. Even though we are still bullish here our bullish position can change quickly if the market follows through and closes out the week on a negative note. It is important to remain objective and not let hopes get in the way of realities. As of the time of this writing, there does not appear to be anything to worry about.

Thursday, December 08, 2005

Bulls Wait to Spring

The broader market continues to consolidate recent gains and recent red bar/green bar up and down days are likely to continue for a few more days at least. One of the better leading indicators for the health of the economy is the semiconductor sector. We believe that this sector is in the early stages of forming a bullish flag pattern. A bull flag is formed after a breakout and serves to work off oversold technical conditions and to create a higher base of support. The implications are in fact bullish due to the fact that profit takers are unable to effect a significant price drop as buyers continue to accumulate shares at the lower end of the range.

To support the argument that the SMH (Semiconductor Holders - above) is undergoing consolidation and not something more you need to pull back to the weekly chart.

From this view it is clearly seen that the price has broken above significant resistance and is merely taking a rest before continuing higher. The green line represents its 200-week average, territory the semiconductors have not enjoyed since the tech bear market began in the year 2000. Not only is a recapture of this territory bullish, but it represents an objective way to measure the beginning of a new bull market in the sector. We believe that we are very close to the point of recognition when serious bears that have been short this year finally capitulate and move to the bullish camp. We believe that a break up from this bull flag could be the catalyst that will convince them to do so. When this happens the market is going to spring forward to dramatic new heights.

Wednesday, December 07, 2005

Gold and Silver Ramping Higher

The last two days we just didn't have a really good feeling about the near term potential for the market. Indices are overbought and nothing really reliable was showing up in our scans. As such we stayed sidelined. Yesterday the broader market made a move higher but on low volume. Late in the day the move was predictably faded and we have indices such as the S&P 500 and NASDAQ 100 leaving selling tails at resistance. Gold and silver on the other hand made a strong move higher and this sector may be the area to play while waiting for indices to correct. The two gaps on the QQQQ mentioned yesterday are ominous at this point and we are very likely to see them filled over the next week or two. Longer term a pull back here is quite bullish. If the market would keep going here it would more than likely be an unsustainable move, which would invite sellers. A rest and pull back will refresh and stabilize the trend.

Tuesday, December 06, 2005

Market Continues its Rest

We are experiencing a pullback in a very strong uptrend. Some traders with a very agile approach will likely try to short the pullback here but we don't recommend it. Surprises in strong up trends usually occur in favor of the trend. This week is likely to be a volatile one and there is a good chance that the open gaps on the QQQQ from November 17 and December 1 will be filled as overbought conditions are worked off here. This will be a good opportunity for the market to shake loose some bullish sentiment allowing the indices some power to push higher once again. The breakout in the gold and silver mining companies is likely to resume its trend soon but at this time there are no favorable entry points. There are a few set ups in the broader market, but risk of failure is fairly high and it's still early in the week. We prefer to stay sidelined another day managing our open positions and waiting for more favorable entries. Keep in mind that waiting for the right time to enter a position as well.

Monday, December 05, 2005

Semiconductors Break Out, Market Needs Rest

Indices traded higher on Friday but an overextended condition still exists despite the back and filling that took place early last week. There is no reason that overbought can't remain so for long periods of time, however, a pullback from these levels should not be contrived as bearish. The QQQQ is trading at the top of its trend channel here and risk of opening new long positions is fairly high as we begin the week. The most important development to focus on from last week's trading is the fact that the semiconductors finally broke above long term resistance levels. The SMH powered over $37, which had been holding it back for months. This breakout represents a move back over its 200-week average, territory it hasn't traded in since the tech decline started in 2000. Since the semiconductor sector is one of the best leading measures of the economy this breakout suggests that 2006 will be a very good year for US markets. Even so, it is altogether possible, and in fact even desirable that the SMH and underlying semiconductor stocks, pull back and back and fill a bit here before moving higher. A base of support has not yet been established so if this new trend is to remain healthy it should take a rest here. Scans weren't particularly strong today, but this is to be expected since the major indices are up against resistance levels. Now that the market is in a strong up trend though we should start to see some second-tier type stocks beginning to make moves as profits taken are redistributed in some speculative positions. Now is the time to be careful, but not necessarily sit on the sidelines.

Friday, December 02, 2005

Panic Buying Underway

The market powered higher with gusto yesterday as buyers waiting on the sidelines piled on top of each other as they scrambled to get in. Fund managers who have been sidelined do not want to answer to fund holders for missing the year end rally and panic buying is now under way. A hard reversal here is unlikely as dips are likely to get snapped up quickly.

Thursday, December 01, 2005

Underlying Strength is Revealed if You Know Where to Look

The broader market continued to pull slightly lower yesterday and volume levels remain high on all major indices. Most people have the idea that high volume at the upper end of the trend represents distribution and that it is a bad sign that the market is ready to make a turn for the worse. In many cases this is true, but it's not always that simple. There are a couple of reasons why we believe the high volume levels over the past three days represent accumulation and not distribution. First, advanced decline ratios have remained positive as more stocks continue to advance than decline. The second reason is more subjective and much harder to quantify. We scan thousands of stocks each day and individually look through several hundred charts that result. On Tuesday you might recall we noted that we didn't find much to act on but that there was little sign that bears were getting a foothold either. Yesterday scans were slightly more positive as small caps and stocks from a few leading sectors started to once again show strength. Today's scans reveal that that positive trend is once again gaining traction as more and more breakouts are following through and more and more stocks are once again moving higher on heavy volume. In fact, twice as many stocks showed up in our volume scan today compared to yesterday. Of those stocks roughly 90% were making moves higher. This is not what market tops look like. Instead, this is what occurs right before a new leg higher gets underway.

Wednesday, November 30, 2005

Pullback Likely Nearly Played Out

The pullback continued yesterday. We wouldn't be surprised to see the market shake lower this morning and then resume the uptrend with a higher close creating a reversal hammer. Remember the fact that we are just entering the month end buying window and buying pressures have been heavy even after seasonal trends have been accounted for. Many of the minor indices were showing strength yesterday as end of the month buying pressures supported them. The Russell 2000 index in particular looks strong and underlying stocks are showing support.

Monday, November 28, 2005

Bracing for a Pull Back

As could be expected, Friday's short trading day occurred on very light volume. There is not much to be gained by trying to analyze performance on this slow holiday weekend trade day. Longer term charts are in very healthy conditions and investment dynamics at this stage support a long term rally to continue. Short term however we should expect a pullback. It is very likely we will get a harsh retracement at some point this week, which will serve to shake out the weak hands. Dips continue to be buying opportunities but dips can also increase the risk on short term trades. The positive side to the equation is that pullbacks help reveal where the strength and weakness is. During rallies all ships (or in this instance stocks) rise with the tide of the rising market. During pullbacks the strongest stocks will do a better job at holding support levels while weaker stocks get hit the hardest. This is because profits from weak stocks are redistributed into stronger stocks. In the long run this will give us a clearer picture where to distribute our money to get the best risk/reward.

Wednesday, November 23, 2005

The Fed Blinks

The big news of the day, and perhaps the explanation for why market participants are wearing their rally hats came from the Fed. Yesterday's Fed notes strongly indicated that the magical word "measured," as in measured rate hikes, will be removed from the next official release. The consensus is that after two more hikes the Fed will stop raising rates at 4.50%. This is an explosive development that will surely bolster the year end rally and quite possibly extend it well into next year. Despite massively overbought conditions, a "get in at all costs" temperament has taken over Wall Street. Don't fight the trend here, but be assured what comes up will come down. The market has the potential to tack on some serious gains as we close out the year and don't be fooled, this is all very bullish action. Even so, the market NEVER goes straight up so we will eventually get a pullback that will shake loose a lot of trading positions. Trailing stops and small share sizes are the best way to play this market until we get a reasonable pullback.

Tuesday, November 22, 2005

Holiday Week, Trending Higher

Volume will be even lower the rest of the week. Traders can potentially use this as an opportunity to chase prices higher. Areas of tech were weak yesterday, but pullbacks in this type of market environment are usually short lived as they lure in bearish traders and then quickly resume their trends. We can't repeat this enough, dips are buying opportunities now.

Sunday, November 20, 2005

Now is the Time to Buy; Most Will Miss it

Now is the time to be fully invested in the market. We repeat, now is the time to be fully invested. Talking heads on the financial channels are going to continue to focus on reasons why consumers should be worried. Perma bears are going to continue to try and focus your attention on the negatives out there all the time ignoring the positives. We let price do the talking and price is telling us that opportunities that have been elusive since March 2004 now abound. Did you know that most individual investors were very bearish during the 1982-1987 bull market and statistics show they were net sellers of stock during that entire bull market.

Again, during the 1990-2000 bull market, the first half of that period was characterized by individuals selling their stocks. It was only during the 1995-2000 period in which individuals were net buyers of stocks.

Are you frustrated with lack of performance in your portfolio over the past year? Cheer up, price and volume are telling us that the future is good. More importantly, they are telling us that right here, right now is just the beginning of the next bull market move. Smart money understands this just like they did in 1982 and again in 1995. The average consumer misses the best opportunities and either comes to the party late or doesn't come at all. Here is why the party is just getting started: After two years of a grueling sideways trading range, the NASDAQ 100 has broken out:

After two years of a grueling sideways trading range, the S&P 500 has broken out:

If history repeats itself once again, then those who recognize this opportunity while it's still in its youth will be in the minority. Don't be in the crowd of sheep who will miss this screaming buy signal.

Thursday, November 17, 2005

Watching for a Gold Miner Breakout

In January of 2003 the XAU (gold and silver index) had a weekly peak close of $111.33, following which, it took a long slide down to the $70s. After several months of recovery it once again peaked for a weekly close of $109.68 in November 2004. It again slid back down to the $70 range. Now we are back up at this resistance level. At the end of August a peak weekly closing price of $112.92 was logged. This time the price did not slide back to the $70 range though. Yesterday the XAU closed at $114.29. This represents a breakout on the weekly charts IF the price does not reverse before Friday's bell. Gold and silver stocks we track have been consolidating and breaking out on heavy volume. Yesterday was the most dramatic action this sector has seen in some time. Gold and silver are not free and clear to run yet, but there is a very good chance that this week may be the week that the sector breaks out allowing stocks to finally run. Note: Cash silver made an 11-month high yesterday and did in fact break above its long term overhead resistance level. The stock market is still dealing with options expiration, so we don't expect to see much more action in the broader market until next week.

Wednesday, November 16, 2005

Dips Remain Buying Oportunities, But Wait

Options week volatility is a bit exaggerated this month as indices continue to be overbought. Yesterday was more of a buyer's strike than it was a sell off. Profits on the table after the recent run up can disappear quickly even in a minor pullback so there was a bit of panic profit taking yesterday afternoon. The area to keep an eye on here is the semiconductors, which have been one of the main market leaders in the recent rally. The SMH reversed sharply yesterday and the closing price left a fairly strong near term sell signal. As you can see, the QQQQ is still well above its breakout point and maximum pain for call buyers is $40. The intraday reversal on the QQQQ yesterday strengthens the chances of options sellers to get the QQQQ down to maximum pain by Friday where they will realize the most profit on their contracts. Such a pullback would be healthy as we believe buyers who missed the breakout are waiting back at the $40 area for a second chance to participate in this rally.

There is little doubt that the market is going to pull back here. We believe that the best position to take during this pullback is a defensive one. There are possibly some positions that are shortable, but risk of surprise generally occurs in the direction of the trend. Since the trend is up, risk on the short side is not manageable for all but the most nimble of traders. After market shocks might be the biggest reason for avoiding short positions at this point.

We may suffer some stop outs as a result of yesterday's hard reversal. Respect the pullback and honor stops here. Buying opportunities are sure to arise out of this pullback, but the next few days are the time to preserve your trading account, not hold and hope.

Tuesday, November 15, 2005

2nd Tier Stocks Under Accumulation

Accumulation continues at these vaulted levels and market indices are working off their overbought conditions by trading sideways rather than pulling back. This is because dips are being purchased by those who missed the breakout. Poor volume levels are positive for bulls at this point as it means that bears are not acting aggressively, even in front of options expiration on Friday. Scans continue to reveal improving underlying conditions as second tier issues are now under accumulation as profits are redistributed.

Monday, November 14, 2005

Dips Are Buying Opportunities

Everyone is calling for a pullback here, which we may very well get. In this market environment shorts and institutional longs are going to start screaming "false breakout" to get you to jump in with them or to get you to give up your shares. Don't listen to them. Dips are buying opportunities here. The market, and tech sector especially, has broken out and everything is lined up for higher prices in the future. Unless a fundamental change is introduced into the market here, such as a massive spike in oil prices, this breakout is firmly in tact. As you should expect to find in a bull market, even as indices are ready to pull back, second tier stocks are just now breaking out. Scans revealed a pattern of good chart set ups unlike anything we have found in many months. Don't forget however that this is options expiration week so volatility is likely to be up sharply.

Thursday, November 10, 2005

Gold Miners To Retest Resistance

The broad market has moved into a sideways trading range. This should last for a few more days at least. This is a healthy way for indices and stocks alike to work off their technically overbought condition and is a very bullish development. As we stated yesterday, stay patient and wait for the opportunities that are sure to arrive. Gold miners meanwhile, which have been looking rather weak lately, moved strongly off their long term trend and the XAU is ready to make another go at overhead resistance. We believe there is a very good chance that this time will be the one where the miners break out of their long term trading range and move into new territory. We won't know for sure until resistance is tested and broken, but right here is where risk is lowest. Once the price breaks out, it will be much harder to find an entry.

Wednesday, November 09, 2005

Patience Will Win

The market is necessarily in the process of working off its overbought condition. At this point stocks look to slightly retrace or trade in place. It is impossible to project how long this process will take to work out, but until it does trading is likely to be fairly boring. We fully expect the market to make another leg higher from the move started mid October. It is important to keep the big picture in mind and stay patient as we wait for good set ups to emerge. Currently a few sectors, such as gold and utilities, look to break down creating some shorting opportunities. Nevertheless, we believe the real advantages in this current environment are to be found on the long side. It would be better to keep cash ready to deploy once the market starts moving again rather than trying to force a difficult countertrend trade on the short side in the weakest sectors. We have booked some nice profits recently and we expect to add to those gains so we ask everyone to remain patient as we let this very healthy consolidation process work itself out.

Tuesday, November 08, 2005

The Pause Which Refreshes

Indices paused yesterday, which is frankly a relief. The last thing we needed at this point is for the bulls to get overly anxious and run prices so high that shorts once again gain an advantage. What we would like to see here, and what we expect, is a little base building. The QQQQ charged straight off of $38 without a pullback. Sideways trading, or even a pullback to support at $39.50 would give the QQQQ a strong base for a launch higher. There are a lot of traders and investors on the sidelines now that did not anticipate this move, so expect the dips to find quick support.

Monday, November 07, 2005

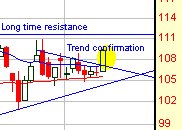
Tech Leadership Breaks Out!

Once again, take a look at the QQQQ chart: What we have anticipated and have been highlighting since September has finally happened. The upper resistance line on the QQQQ has been broken on a weekly basis. Confirming the breakout is the SMH (semiconductor sector), which bounced firmly off long term support and is now embarking on the next leg up in its long term uptrend. The Dow and S&P broke above their pullback resistance levels and are also in confirmed up trends. This is a market that is firing on all cylinders. This is a market that we anticipate will provide opportunities not enjoyed since the year 2003.

Thursday, November 03, 2005

Nasdaq 100 Testing Breakout Levels

Take a look at yesterday’s QQQQ chart:

It broke downtrend resistance at $39 on heavy volume and closed just below the all-important $39.50. We mentioned these two numbers in yesterday’s report. Moving over $39 should be considered a breakout and bears have their backs against the wall here as money that has been sidelined for months is starting to come in. Investors are starting to get worried that they are going to miss a 4th quarter rally, as well they should.

The real test is yet to come however. $39.50 represents resistance drawn from October 2004’s peak (see weekly chart above). In fact, this basic level has represented overhead supply (resistance) since January of 2004. A strong break above $39.50 would put us into a new bullish era that could last for a couple of years. More importantly, it would take us out of the grueling trading range that for the past year and a half has made it very difficult to take money out of the market and that has led to periods of trading account draw downs. A sustained move over $39.50 would be significant indeed.

What has been holding back a tech break out? The weak semiconductor sector has. Take a look at the SMH chart below and notice the very strong bounce off its long term uptrend. This sector is ready to rally in the 4th quarter and we should see some nice gains to the upside starting from this move.

Wednesday, November 02, 2005

Weekly Likely to be Slow in Front of Employment Report Friday

It is tough to keep a near term bullish outlook after today’s scans. The intermediate outlook still remains bullish, but for the rest of this week bulls have their work cut out for them. The QQQQ has immediate overhead resistance at $39 and support at $38. We will be surprised if it bumps over $39 in front of Friday’s employment report, more likely it will drift back toward $38 support. One of the reasons we believe this is a possibility is due to the once again weak semiconductor sector, which is again heavily testing its long term trend. The SMH must hold $33 or things could get ugly for a few weeks.

Tuesday, November 01, 2005

Monday's Follow Through Confirms the Reversal

After yesterday’s follow through day we can breath a bit easier as the trend works to establish itself. There remains risk that yesterday’s gains will erode today as the day traders have “learned” over the past two weeks to aggressively sell the rallies on the following day. Nevertheless, we believe that prices will become more stable and that the overhead resistance levels on the major indices will once again be tested in coming weeks. This is a market heading for something big. Increased volatility indicates we are heading for a large break out or large break down in the next few months. The charts favor a break to the upside at this point.

Monday, October 31, 2005

Friday's Trend Test a Success

On Friday the major indices survived the trend tests we outlined last week and we saw sectors bounce pretty much across the board. Most importantly, the SMH (Semiconductor Holders) saw buyers step in at its long term trend and the closing price left a strong high volume buying signal in the sector. Since this sector has been the anchor around the neck of the NASDAQ recently, a rally there should let tech take off. We should note however that we do not expect a sharp move off of support levels just yet. The bond market is still trying to find a bottom and as long as bonds continue to lack stability, the trading range in stocks is likely to continue. There is evidence that smart money is using this stock trading range to accumulate.

Friday, October 28, 2005

Important Weekly Trend Test Today

Today is a very important day for the market, one which could make or break the near term bullish case. As you can see on the QQQQ (NASDAQ 100) chart below, $38 represents long time support, the trend it has been following since 2003. For the past two weeks support has held in this area and there are good reasons to assume that the price will hold here once again; not the least of which is the fact that end of the month buying should kick in today. On the other hand sell signals are flashing across the board after yesterday’s heavy retreat of the buyers. The market should bounce here, but we know that the market doesn’t always do what it should do, so we need to prepare ourselves for the other potential scenario that could develop out of a break down here. Should $38 give way this week, short set ups will be confirmed and we should look for the QQQQ to drop back to $36 over the next few weeks. Today is a great day to sit back and watch to see what develops out of this trend test.

Thursday, October 27, 2005

Be Patient in Front of the Month End Buying Window

Traders have been nervous over the past couple of days as the bond market has been falling. Today’s scans revealed a plethora of short set ups and few stocks worth looking at on the long side. Looking at the market in a narrow time frame, forgetting to filter out market noise and swinging with the crowd here it would be very easy to jump from the bullish camp to the bearish camp. Interestingly enough however, when panning back to a weekly view, stocks that are setting up short are oversold and showing bullish divergences. Likewise, it is our view that it would be trader suicide to short the market a day before the month end buying spree kicks in. In other words, we believe we are seeing the making of a bear trap; a situation where shorts are enticed in right before bulls fire back. The bond market is bottoming and as mentioned numerous times this week, we expect buyers to come back in either today or Friday. There is a strong risk for bears that they will be caught on the wrong side of the tape and will get squeezed like they did a week ago Wednesday. This is a market that is rewarding the patient right now. Good set ups on the long side will come as the traps are sprung. We may or may not see lower prices today, but we believe that by Friday or Monday the bears will be screaming uncle! As always, we will wait for confirmation before we buy in to this theory. Today we will wait for better set ups.

Wednesday, October 26, 2005

Back and Fill Day

As expected, we saw some of Monday’s gains retrace yesterday. The fact that a majority of the gains held however is a positive for the bullish case. Likewise, the fact that the market closed strong shows that smart money is still using the weakness to add to their long positions.

Tuesday, October 25, 2005

Tech Pulls Market Higher

Yesterday was catch up day for the blue chips. The Dow was up 170 points and the S&P 500 up 20. Tech heavy NASDAQ however remains out in front and considering that the 5-day end of the month buying spree should kick in by Friday, there remains a strong possibility we will see tech break out of its trading range soon. Note the weekly QQQQ chart below. Two weeks ago it bounced off its 50-week average and long term trend line. Yesterday it closed just .34 below $39.50, a number which represents overhead resistance on its trading range. Its refusal to drop back to the lower support on its trading range betrays the fact that it has underlying strength. A weekly close over $39.50 will mean good times ahead for the bulls.

Today may give back some of yesterday’s gains. This market is once again climbing a wall of worry and a retracement of some of the gains will encourage the bears to get more aggressive again. This would be bullish since short covering combined with end of the month buying power could be the catalyst that pushes the QQQQ through overhead resistance.

Monday, October 24, 2005

Sector Rotation Into Tech

We start the week with the major indices, “The Generals,” diverging from one another. Most striking is the fact that the S&P 500 shows a weekly breakdown from a triangle pattern; volume over the past three weeks. Meanwhile, the tech heavy NASDAQ has enjoyed the influx from a sector rotation out of the oils and back into tech. Earnings reports have been positive for the most part and projections are looking good so smart money is moving back into this sector that has lagged since the market crash at the beginning of the new millennium. The QQQQ is right at support and showing some very nice weekly bullish divergences on its indicators. A retest of its recent highs is likely imminent and a breakout to new highs is back on the table as a reasonably probable scenario before the year is out. We are moving into the monthly buying window, which should have indices moving higher later in the week.

Thursday, October 20, 2005

Market Buys the News as Bulls Come Back Strongly

Shorting yesterday would have had disastrous results. There’s an old saying: Never short a boring market. While this market has had an increase in volatility lately and the VIX has in fact broken out of its trading range (indicating an increase in volatility), the market over the past few days has been merely drifting. We were looking for the market to break lower yesterday, but because the signal was not clear we felt it better to stay sidelined. This proved to be the best course of action under the circumstances that ensued. Is the market ready to turn up here? That’s the big question that is now on the table. Today the S&P and NASDAQ alike put in a wide range bar, not unlike the way the market traded in early May and early June as the market rallied off the lows of what is turning out to be the market’s trading range. In fact, today was the largest wide ranging bar in nearly a year for the QQQQ. The last time such an event occurred was October 27, 2004. We encourage everyone to pull up their charts and see what occurred from that point.

Wednesday, October 19, 2005

Waiting for a Better Signal

There is a big difference between what the market should and could do and what it actually will do. For example, the market sold off hard at the beginning of the month and then last week strong signs of support appeared, which were confirmed by generally oversold conditions and overly bearish sentiment. As such the market COULD have and even SHOULD have started an oversold rally. What the market actually did do however is put in a weak dead cat bounce that is quickly running out of steam. Now we are faced with an altogether different set of market signals than we were at this time last week. The oversold conditions are working themselves off without a significant price level improvement. Now we find that the market COULD and even SHOULD sell off further from current levels making another leg down in the downtrend started October 4. But will the market do what it could and should do here? Since this is options week the answer becomes a bit more tricky. We think the market will make a new leg lower before it finds a significant level of buying support. If the market follows through on yesterday’s weakness the odds will more heavily favor such a breakdown raising the probabilities of success on the short side. Today is a good day to stay sidelined as we wait and see if yesterday’s weakness was the real deal or just a one-day wonder.

Tuesday, October 18, 2005

Volume Levels Problematic

If the market can hold on today gains made over the past two trading days this week then we are likely to see a run back to long term overhead resistance. If however the prices start to weaken at their current levels and start to roll over, then it will mean this market rally we are in was very short lived and had no steam behind it. Poor volume levels yesterday indicate that bulls may already be running out of steam.

Saturday, October 15, 2005

Oversold Bounce, But...

It’s a tough call to make here as we move into options week. Stocks are oversold as well as indices, but the S&P closed the week below support – most technicians would agree that’s a warning sign that lower prices are yet to come. The NASDAQ on the other hand closed right at its long term trend line, though it is hanging by a thread. It must reverse and make a move higher from this level or a downtrend will be confirmed. Right now we are in the camp that believes the selling is not yet over, but that a near term bounce is fast approaching. We saw beginnings of such a bounce on Friday.

Friday, October 14, 2005

Oversold Condition Starting To Attract Buyers

There have been signs since Wednesday that some of the more oversold stocks are running out of downside momentum. The QQQQ, SMH, and have recently sliced through their respective 200-day averages like a knife through butter. Panic ensued and stocks were dumped more out of fear than from reason. A quick study of index history shows however that the 200-day average is not an area that falls quickly. Bulls will battle back for this average and further selling is going to get swept up by smart money who understand this. Who will win the battle is yet to be determined. It is almost a sure bet however that prices will start to bounce back up as the battle back from the lows begins. If bulls have enough weapons in their arsenal we could see a rally ensue from the ashes. If not, and prices merely limp back to their 200-day averages, then we are likely to see the downtrend resume. Right now however it pays to bet on the bounce; after which we will wait and see what develops from that bounce.

Wednesday, October 12, 2005

Bulls Losing Control Near Term

About the only thing positive we can say about the market at this time is that stocks are getting rather oversold and the QQQQ is at its 200-day average. Other than these two factors, the charts look to trade lower. Our bias is moving toward near term bullishness but we remain neutral in our assessment for the long term at this time. Though we believe indices are due for a bounce near term, the trades are still on the short side here. The short side is providing a plethora of set ups pretty much across the board. The market will have to bounce with conviction to reverse the poor technicals that have been developing recently. For now we believe it prudent to bet against a strong bounce as we believe that sellers have control for now and any bounce will be short lived.

Tuesday, October 11, 2005

Negativity Creates Opportunity

Yesterday the indices put in another real distribution day. Since the indices had sold down to support levels on Thursday a distribution day at support cannot be a good thing if you are a bull. As we said yesterday, we are not strongly biased about this market. It has in the recent past sold off below support levels only to recover and follow through with new gains. Even so, we are glad to see some real volatility return. The VIX has broken above its $15 resistance indicating some real emotion has been injected back into the game. This market is one that has been limping up to test support over the past year and over the past few months has experienced a noticeably decreasing level of breadth as fewer and fewer stocks participated in the gains. Now that we are getting some downside movement breadth has returned to 2-1 participation in the move. The key point to understand here is that the market is moving and that is a very good thing. We are not ready to use the word bear market here, but, keep in mind that bear markets create some of the best bullish bounces and provide for some of the best trading opportunities on both the long and short sides as prices oscillate on extreme fear and speculation. So, if the market does in fact not break out to new highs as we speculated last week, a break down to past lows can provide as many or more trading opportunities. Anything is better than a lazy trading range.

Monday, October 10, 2005

Conditions Neutral

After last week’s hard sell off stocks and indices are oversold. Of course in a downtrend oversold can become more oversold. So far however, only the NASDAQ has broken down. Unless other indices follow we cannot count the current environment as a downtrend. Stocks could potentially still pull back higher. If they are going to, they need to build a base at the current level, which will help repair some of the technical damage incurred last week. Scans today were not overly negative, nor were they overly positive. We start the week with fairly neutral conditions and we have no bias as to what will develop next at this time.

Friday, October 07, 2005

Market Congestion Problem is Clearing Up

After three months of moving sideways the market has finally felt an injection of activity. It is highly likely that a major move will emerge from the ashes of this week’s hard reversal that will likely last into the end of the year. At this point there are good arguments for why the move could go either way. If prices stick today and buyers come back in aggressively then we could see a breakout to the upside, which takes out old highs and puts back into play the scenario we were outlining last week. If the buyers remain timid and sellers continue to play offense taking out the 200-day averages, then we could see a turn south over the next few months that will do a lot of damage to the portfolios of long term longs. Either way, the congestion pattern is breaking up and trading volatility is returning, which can only be a good thing for our trading style.

Thursday, October 06, 2005

Nearing a Bounce?

Yesterday’s strong bearish follow through drove the major market indexes down through their daily support levels. This selling could potentially take the market down to a climactic reversal point in tomorrow's session. There is a good probability that the open will provide an exhaustive gap to buy into. When there is blood on the streets, bottom fishers come out in droves.

Wednesday, October 05, 2005

Market Reverses Hard Mid Day

The market did a 180 degree turn mid day yesterday as bulls ran out of gas and shorts took the wheel. Bullish set ups from yesterday’s scans gave way to selling and today’s scans turned up a very bearish near term picture. The market is now undoubtedly heading back to August lows where we hope that it will find support. It is once again time to buckle up and get defensive as yesterday’s overall sell signal is one that should not be second guessed. Likewise, the gold and other metal sectors took a turn for the worse yesterday even as inflationary worries were reported. Add to that, even oil turned south yesterday. We may be in for a few days of wholesale selling.

Tuesday, October 04, 2005

Tech Bears Have Their Backs to the Wall

There is an underlying bullish bias that cannot be easily seen when merely analyzing market indices. The SMH and QQQQ both left bearish selling candles yesterday at their overhead resistance areas. This indicates that we may see indices retreat somewhat this week. However, drilling down deeper and looking at the underlying stocks themselves reveals an altogether different picture. After a dismal June, July the market rallied strongly off of support. At the beginning of this rally we found a number of stocks putting in double bottoms and we found other stocks trading in and/or breaking out of accumulation patterns. These same type of patterns have been showing up in our scans over the past couple of days. Today, after yesterday’s late day bearish market reversal, we find only bullish set ups in our scans. This is a strong divergence between the market indices themselves and we think it projects an underlying bullish current that is building in the market. We need the weekly signals, which we highlighted in yesterday’s report, to confirm before we can aggressively buy this market. At this time it looks hopeful. Note that chip stocks, despite yesterday’s late day SMH reversal, are doing rather well here. We uncovered several double bottom patterns in today’s scans that reveal and underlying current of continued recovery in this sector. ADSX and ATML are two good examples of what is taking place in this sector.

Monday, October 03, 2005

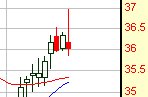
Very Important Market Test Coming Up

On Friday we mentioned that several major market indices produced a weekly buy signal. In particular, the tech sector has been at the front of this move as both the semiconductors and broader tech market represented by the QQQQ closed firmly for the week. Of even greater interest is the fact that the sector is now consolidating directly below major overhead resistance; the same resistance that has fenced in prices over the past two years. A break above this resistance would have very significant implications on our trading success rate. Over the past year especially the market has been trading in a coiling pattern as prices bounced between support and resistance without making any forward or negative progress. This has left many trades cold as breakouts and breakdowns have been faded, causing both to fail. Should the QQQQ break through overhead resistance, we will find that stocks will start to make some good moves, develop better trade set ups, and actually follow through from those setups. We look forward to the next few weeks to see what develops out of this situation. Note that the QQQQ is trading just below weekly resistance. A break here could have a significant impact on trade development. (A failure here would have prices moving back towards $36 support where we would expect a regrouping effort followed by another attempt at $40 resistance.)

Friday, September 30, 2005

Bears Get Squeezed; Today Very Important

Shorts got caught leaning too hard yesterday in anticipation of a breakdown from the bear flag set up we have been analyzing this week. Oftentimes when a signal or set up is so obvious that everyone sees it, it is better to take a contrarian approach. The reason is that if too many traders are leaning one way and the market has not yet moved in their direction, there is nothing else the market can do but reverse. Bears had their capital committed for a breakdown, then end of the month buying kicked in as retirement money started flowing into the market. Subsequently short stops triggered, shorts started to panic and run for the exits and prices cranked higher. The $100 question is, was yesterday a one day event or was it the start of a greater upward thrust? Since we know that buying generally kicks in for a few days this time of the month, we hesitate to get too excited about yesterday’s move. HOWEVER. If you pan out to the weekly charts on both the NASDAQ and S&P 500 an interesting development is brewing. Yesterday’s trading corrected the broken downtrends on both charts. IF, and it’s still a big if, prices can close at least as high today as they did yesterday, and preferably higher, we will have weekly buy signals on both major indices. Additionally [now we are moving from analytical mode to purely speculation mode], if we get a weekly buy signal that turns into a breakout of both major indices, we could see a real bull market develop and see some real fireworks as we move into the end of this trading year. From the beginning of 2004 the markets have been moving pretty much sideways. We experienced decreasing volatility and have made no real progress during this time frame. Suffice it to say, we have had to work excruciatingly hard to pull money out of this market. Money that was easy in 2003 has not been for the last 18 months. That said, the indices are now trading only slightly below overhead resistance levels that have kept this market fenced in during this time. We want to highlight this: If the market holds here, right here this week, it would be reasonable to expect a run at overhead resistance. The QQQQ is trading at $39.20 and only needs to close over $40.00 to break out. The SPY is trading at $122.66, and only needs to close above $125.00 to break out. Prices have been bouncing off these two levels for almost two years. If the weekly up trends hold here these two levels could face their first TRUE test in more than 18 months. Will it happen? Will we get a test of overhead resistance? And if we do, will we see a breakout? These are questions that no one knows but the implications of such a breakout would be a huge boost to our own bottom lines.

Thursday, September 29, 2005

Bulls Look Very Tired

The bear flag development mentioned yesterday has been playing out with a great deal of stocks. This indicates the underlying trend is down and ready to make another leg down despite the end of the month buying window we are now in. Window dressing may or may not hold off the inevitable, but considering the weak behavior on the long side, including broken trends, bear flags that are developing in numerous sectors, and poor volume on up days, the path of least resistance points down.

Wednesday, September 28, 2005

End of Month Buying May Just Delay the Inevitable

As you can see from the QQQQ (NASDAQ 100) chart below the tech sector is in a precarious position. The uptrend has broken and has failed its first test. Its last line of defense is $38.25. If that level breaks down a downtrend will be firmly established and it would be well advised to trade the short side until the trend corrects itself. The semiconductors, which led this tech rally to begin with, have already broken through their last line of defense so probabilities favor a breakdown of the broader tech sector. Even so, today marks the first day in the end of the month buying window that nearly always takes place due to an influx of retirement account money into the market. While new money is being deployed, a great deal of shuffling takes place as funds redistribute their accounts. This should give the market some temporary support. We need to use this opportunity to put together a list of good short set ups. Ideally it would be great to see the broken trend line on the QQQQ (above) be retested near the $39.00 level. If $38.25 breaks first however, all bets are off and shorts should be established at the breakdown point. Interestingly enough, there were a number of bull flag failures in the gold sector yesterday. The sector still has a chance to hold support, but this development is the first strike against a bullish case. Bottom Line: We are hoping for a good wash out slide in the market during the month of October. The market has been moving up weakly on poor volume and even poorer breadth. Trade set ups have been failing at a much greater rate than they were during a similar rally last fall. This is a market that needs to shake loose a few cobwebs and a good retest of July’s lows would be a nice way to establish some volatility and increase buying interest once again. The short side has not yet produced a large number of opportunities. However, if the last line of defense on the NASDAQ is broken through we would be willing to bet that downside breadth will be plentiful. This will provide us with reliable set ups on both the downtrend and also good set ups on the following bounce back up. In short, much needed volatility could be reestablished under such a scenario.

Tuesday, September 27, 2005

Bearish Fears Project a Bounce Sometime This Week

The put/call ratio has once again turned overly bearish as traders reacted to the sell off at resistance yesterday. Technically the indices are set up for a good short, but considering other factors such as unsustainable levels of bearishness and the approaching end of the month buying window, there is a potential for a short covering rally to ensue this week. We could very well see prices dip back down to their August lows but it is likely we will find support there. Gold is either basing for a move higher or is under distribution and ready to reverse course at long time resistance one more time. Technically it appears that the miner stocks are basing for a move higher, but until they make their move out of their current intraday ranges we won’t know for sure.

Sunday, September 25, 2005

Oil Falling Over the Weekend, But is it Enough?

We highly recommend remaining in a cash position at least through Monday as we wait to see how the market reacts after Rita and how it continues to price in events from Katrina. Oil futures are taking a hit this weekend, but anything could happen on Monday. Major trendline damage has occured on both the S&P and Nasdaq indices and we are not yet convinced that falling oil prices will be enough to repair the damage incurred. When we just don't know what will transpire it is just better to wait for a clear opening before throwing money back into the market.

Friday, September 23, 2005

A slight weakening in Hurricane Rita was enough to deliver a pretty good bounce in the late afternoon yesterday. We had a quick spike in the morning when breadth was almost 3 to 1 negative, but that slowly faded until news of the downgrade in Hurricane Rita hit. Crude oil pulled back as traders faded the breakout to new highs and stocks bounced as the winds slowed from 170 mph to a slight breeze of just 150 mph or so. This market is all about trying to guess how well we have priced in the inevitable damage. Anyone who thinks the market is an accurate discounting mechanism is probably teaching college finance somewhere. The rest of us know that this market is clueless about the fallout of Hurricane Rita, and it is acting like it, by bouncing around randomly. Today we should see more of the same. This is just not a market we want to get in front of. We hope negativity returns today so that a serious relief rally can ensue next week. If optimists bet on the relief rally today however, it could set us up for disappointment next week. So in the bizzaro world of trading, negative today is positive next week, positive today is negative next week. This is one confused market and what works under "normal" conditions is just not working right now.

Thursday, September 22, 2005

Defensive Trading in Front of Rita Wreaks Havoc on Trades

Selling in front of Rita continued yesterday putting market players in a defensive posture. As we stated last week, this environment demands flexibility. Rita threatens to be as destructive as Katrina, and as such could strike a hard blow to the US economy and cause energy prices to spike even higher. Gold prices are extended, but after closer examination of the sector, we question whether the miners are still shortable here. We will need to see prices start to roll over before we would get serious about shorting the sector. Meanwhile energy prices are ramping up once again and big money is making bets on higher prices as many issues are seeing large volume breakouts in front of Rita. Prices may or may not reverse next week as profit taking hits the news (they certainly didn’t in the wake of Katrina), but right now the sector is very strong.

Wednesday, September 21, 2005

Bulls Have Their Backs to the Wall

The bulls have one last shot to snatch victory out of the jaws of defeat. It is a rarity when the market follows through the day after the Fed meeting, so if they can close the NASDAQ back above 2150 bulls will remain in the game. As it stands now, bears have the upper hand as seen by yesterday’s trend break. The S&P on the other hand has not yet broken. The question here is will tech pull down the market or will the broader market lift tech? It is highly unlikely that the two will diverge for long. If the NASDAQ follows through lower today or fails to recover the trend, the short side of the market will then provide the most probable opportunities.

Tuesday, September 20, 2005

Gold Shares Projecting a Top

The story for the day yesterday was gold. After a parabolic move over the past couple of weeks gold shares reversed hard and on volume. The move up was more than likely built on speculation and not on a true character change in market supply and demand for the precious metal. Technically gold is at the top of its range and if it remains true to its character, it is ready to oscillate back down to the bottom of its range once again. If the Fed doesn’t raise rates today this may change, but from the way gold shares traded yesterday, sentiment clearly favors another rate hike.

Monday, September 19, 2005

Trend Depends on Fed

Trends were tested hard last week, but at least initially they are holding here. We are at an important line in the sand for the semiconductor sector, which had been an important leader in the rally started last summer.

The S&P, like the NASDAQ, held firmly this week and both indices left good high volume reversal signals at their respective trends so we expect to see bulls in charge as we begin the week.

Important to note: The market is screaming bounce here. It’s oversold on a trend line pullback in a larger uptrend. The potential curve ball could come from Greenspan and the Fed. If they raise interest rates this week, and despite what talking heads assume there is a good possibility, it could be seen as a bearish development. We may be forced to cash in our bullish chips should the market react poorly to the Fed meeting Tuesday. Given the various pressures on the market at this juncture flexibility is an absolute must.

Friday, September 16, 2005

Triple Witching Day

Yesterday's market was pretty much flat after Wednesday's sell off. With triple witching day today we have to consider the probability that prices are being “parked” into their maximum pain values where option sellers maximize their profits. The market has a very bearish feel to it here, but this “feeling” is at least partially skewed by today's contracts expiration. The QQQQ is trading in a bear flag on its daily charts so it may drop lower today. Trend support is just below $39 and maximum pain is $39. We have to wonder that this trend might be in jeopardy next week. We didn’t trust the throwback on gold late August. It looked like a breakout failure like so many stocks and sectors over the past year so we missed the initial strong leg up in this newly developing bull trend. Gold miners are extended at this point but a pullback here should provide for a nice buying opportunity. If it starts to pull back here, we would like to see the XAU retrace to around 101-102 where we believe it will have support.

Thursday, September 15, 2005

Market Slides Toward Maximum Pain

Yesterday stocks were stung as the nuetral market trend gave way to pressure from options sellers using higher energy prices to dip prices toward maximum pain levels for this Friday's options expiration. Maximum Pain is the price point where the maximum amount of dollars will be lost by option speculators. When the market trend is near neutral option short sellers can control stock prices and "park their cars" on strike prices which extract the most money from the speculators. For the QQQQ (NASDAQ-100 Index), the Max Pain price this month is 39. For the OEX, it's 570. QQQQ closed Wednesday at 39.19 and OEX at 567.41. We expect that yesterday's harsh sell off, which showed little mercy to UBET, will ease up and we may even get a small bounce. The market is most likely to trade relatively flat moving into the end of the week. Longer term the trend is still up so next week we may see some good upside as option sellers release thier grip.

Wednesday, September 14, 2005

Monitoring the Semis for Continued Upside

This rally started with the semiconductor sector leading the way. Yesterday the S&P 500 experienced a distribution day and the NASDAQ indicated it needs to pull back a bit before it can tackle overhead resistance. However the semiconductors, the lead dogs for this rally, are trading right at their breakout battle grounds. The SMH is right at its long term trend and price is testing breakout levels. If it can hold up through the week and close above $37.50 by Friday we should start to see some real breakthroughs in the tech sector.

Tuesday, September 13, 2005

Market May Trade Flat for a Couple Days

Scans were thin today, but that’s to be expected now that the market has some resistance to deal with along with triple witching options day on Friday to contend with. We will most certainly get some bumps in the road along the way, but the technical condition is looking fairly bright here. Here’s some interesting analyst comments from MarketWatch: Money management and research firm Bridgewater Associates thinks stocks "look cheap," not just in the U.S. but globally. The firm said its research suggests earnings yields are currently about 2% higher than bond yields. In addition, the stock markets of developed countries are on a whole 20% below their pre-bubble peaks, while unadjusted earnings are 35% higher and bond yields are 2% lower. "The current pricing for global stocks is as pessimistic as it has been in a generation," Bridgewater said in a recent note to clients. "While global equity prices have risen in recent years, they have paled in comparison to the increase in earnings and have not reflected the drop in bond yields." That helps explain why the stock market seems to get a boost whenever the 10-year Treasury yield approaches 4% -- stocks are just too cheap to ignore. The resulting asset shift into stocks has led to short-term run-ups in bond yields, like the rise seen over the last week, but as we've seen over time, these gains have proved relatively short lived.And the following declines are starting to go lower and lower, which should, all things being equal, make stocks look cheaper and cheaper.

Monday, September 12, 2005

Climbing a Wall of Worry

The market is scaling a wall of worry here in face of higher oil and talk of a slowing economy. The S&P broke out to close at its highest weekly high in 4 years and as we start out triple witching week the NASDAQ is threatening a breakout as well. The secret here is to not over think this situation too much. The trend is up, and while it may be a cheesy platitude, the trend is indeed our friend. Last month was a miserable month where prices chopped around creating very few trade opportunities. In hindsight we can see now how that action, which was poor for trading, was creating a base of support from which stocks could launch an attack on 4-year breakout levels. We are not there yet, but last week ended on a positive note. Let’s see if this week follows through.

Friday, September 09, 2005

Up Against Key Resistance

The semiconductor sector is testing its 52-week highs but breadth in the sector is thin so today is going to be a key day to watch. Meanwhile the NASDAQ and S&P look ready to pull back, so unless volume and price move higher here the rise started last week could be on its final legs. Again, today is key.

Thursday, September 08, 2005

Market Inches Higher

Volume remained strong yesterday and price action was fairly positive. It is reasonable to assume that since indices recovered their 50-day averages so convincingly over the past few days of trading that we will at a minimum see a retest of recent highs. Likewise, double tops are fairly rare, so we could see a fairly decent rally take shape over the month of September. Elliot wave patterns put both the S&P and NASDAQ at the crux of a 5th wave development. At this point we are taking a “wait and see” approach and will be watching carefully for any warning signs that the trend is faltering.

Wednesday, September 07, 2005

Negativity Withers as Bulls Rally

The ability of the market to shrug off last week’s events and push higher yesterday seems to reveal an underlying resilience that was unexpected by many including us. The potential end to rate hikes may be the catalyst sending prices higher here. The QQQQ and SPY rallied on strong volume. From here it looks like at the very least recent market highs will be retested. It’s nice to put a dreary August in our rear view mirror and see some volatility return. It is hard to say how much gas this rally has behind it, but that is a question for another time. Right now we need to get in while the getting is good. Breadth was strong yesterday and scans revealed a strong number of new 52-week highs and stocks testing breakout levels and/or breaking out. Volume was strong across the board. This is not a market that is playing defense.

Monday, September 05, 2005

September Starts Neutral to Negative

The hurricane events over the past week have really thrown the commodities markets into frenzy. Already extended oil prices spiked even higher as damage assessments rolled in. It is difficult to complain too much about the damage this did to our oil shorts when considering the fact that so many are now without homes or worse as they still continue to deal with the aftermath. The market is still trying to work out what the long term economic impacts on the US economy will be and bets on and end to interest rate hikes are now being considered by the market. Equities are in a tough spot here. The NASDAQ, as pictured below, moved back up to broken support in a throwback pattern. Technically speaking, this is a short set up. Scans however turned up neutral over the weekend and we really need to see the index break lower before we will get any decent short setups here. So, while odds favor at least the technical sector rolling over here, it is best to be patient and wait for follow through. It will be interesting to see what note this week will begin on.

Saturday, August 27, 2005

This Week's Schedule

The market blog will not be updated this week as the analyst who normally contributes his daily market analysis will be on vacation. The blog updates will resume on Monday, September 5, 2005. Have a great week everyone!

Friday, August 26, 2005

Let's Take a Look At Where the Advantages Are Now

August has watched the market chop up and down making it difficult to predict direction. This week however we experienced a clear distribution signal as both the NASDAQ and S&P sold below their trend lines on heavy volume. Currently the market is very oversold and clearly we are due for some sort of bounce. Wednesday’s sell off however was a warning shot across the bow for the bulls. We argue that smart money has been using choppy trading this month to sell off the tops wearing out the ammunition bulls had in their arsenal. This means that any rally that begins from current levels will do so with odds favorably against its success. Let’s take a look at the NASDAQ and S&P charts so that we can see what stocks are up against here. While the NASDAQ 100 broke its trend only this week, the NASDAQ itself chopped through its trend over a week ago. On Wednesday it tried to recover, but instead experienced a strong distribution day. Keep in mind that it is very oversold here and due for a larger bounce. We argue that that larger bounce will only take it to the under belly of its broken trend where it will face daunting resistance. When it does return to the broken trend it is likely going to be a very nice short.

The S&P is in much worse shape, but the scenario is the same. We are looking for an oversold bounce to take it back to its broken trend. This will set up a short opportunity.

Now let’s take a look at the oil sector. We’ve been mentioning this week that it looks to be working out a topping pattern. Oil prices experienced a sharp correction last week and have since merely moved back up weakly in what we believe to be the “B” leg of an A, B, C downward correction. Prices could move slightly higher from here, but they are under pressure and are very likely to experience a heavy amount of resistance at current levels. Why? Markets forming tops after a strong trend often have a sharp sell-off and then make one last attempt to resume their longer term uptrend. This resumption is caused by bargain hunters buying at what they perceive to be low levels and by shorts taking profits (buying to cover). And, it can be accelerated by shorts being squeezed out. However, this action often exhausts itself before the market makes it back to its old highs. When this occurs, a true top is then formed. The chart below is of the oil services index, XOI and the pattern described here fits this chart very well.

Thursday, August 25, 2005

An Important Support Failure Occured Yesterday

We’ve looked and we just can’t find anything positive about yesterday’s index breakdown. The reasons why it occurred don’t matter nearly so much as how the market reacted to the reasons. Whether it be derivative issues, high oil prices, or speculation that the fed might overshoot on interest rates, the fact is the market sold off at support and it sold off hard. The toughest part about market analysis and the toughest part about trading is trying to determine whether a market pullback is just a simple bit of profit taking or whether it represents a character change. If it’s just profit taking you try not to fight it, but you don’t get aggressively short since it doesn’t take much to trigger a reversal. If it’s a character change, then you don’t know until you get some sort of confirmation. Yesterday provided confirmation that we are experiencing a character change from the bull trend started last April. We now know why August has been such a miserable month. Smart money has done a good job recently at hiding its intentions. They have been leaving small footprints, likely by setting up program trading to sell small amounts at daily price extremes. This has weakened the will of the buyers to the point that yesterday they had no more ammunition left when they were forced to defend the uptrend. We won’t make any projections at this point what sort of target to look for or how long this downtrend will persist. We need more information before we can do that; in other words, time. Right now the market is still very deeply near term oversold and due for a bounce. What changed after yesterday’s sell off however, is that now we need to use the bounce to find shorts. The sell off confirmed the downtrend and there is nothing worse than trying to fight against the trend. We’ve tried to avoid the trend all month by focusing on commodities, but even these areas are destabilizing. Oil, which sold off hard last week, is in the throws of a bounce here. We would argue that it looks like a topping pattern underway. Gold broke out a few weeks ago in what it turns out was merely a bull trap. The breakout failed this week and gold prices look to reestablish their downtrend or at least trade sideways for a while. Today we need to watch the market’s reaction to yesterday’s selling to see where to best position ourselves. Scans are not yet turning up strong short patterns and long patterns are not to be trusted for the time being. Note: Check the calendar for updated instructions on the stocks TSM and AEM. Likewise, we will be providing an email update on long term stocks to Gold and Bronze members today.

Wednesday, August 24, 2005

Bounce Still Imminent

Oil prices are once again shooting higher. It’s hard to determine yet if this is part of a topping pattern or if prices will continue to move higher. Considering the hard sell off last week, we would tend to lean toward the theory that oil is in the throws of a topping pattern. Meanwhile, though market indices did next to nothing yesterday, a number of small cap stocks were once again popping higher out of their bases. We didn’t find much that was tradable with our own risk guidelines, but the fact that there are some areas of strength returning to the market indicates that selling pressures are easing significantly while the market continues to test support levels. Options traders once again spent the day yesterday buying nearly twice as many puts as they did calls. This overly bearish position by this group of not so lucky traders continues to strongly support the contrarian view that we are at the bottom of the correction.

Tuesday, August 23, 2005

Expecting a Bounce

Underlying breadth wasn’t particularly strong yesterday, though scans didn’t turn up anything particularly negative that might warn us that we are at risk of a breakdown here. The wide ranging doji at the trend lines on both the NASDAQ and S&P indices is about as good a reversal signal as any other we have come across and we need to honor it (see QQQQ chart below). The signal is complimented by both oversold, but improving technical indicators and by the fact that options traders have reversed course from an overly bullish position to one that is overly bearish. Options traders are very good at calling reversal points in the market in that they are so often very wrong in the positions they take. When a majority of call options are being purchased like they were at the end of July and the first of August, we can just about be assured the market is overbought and ready to collapse. Likewise, when a majority of put options are being purchased, we know that these unlucky traders are becoming overly bearish and that a reversal to the upside is fairly imminent. Yesterday they were buying puts hand over fist. Allow for some volatility here. They may try and shake loose a few more shares before it reverses and suck in a few more unlucky put buyers, but we can just about be assured the market will bounce from very close to current levels. We don’t know how strong the bounce will be yet as there is just no way to determine this. It makes sense to start buying at these levels though and then make adjustments as necessary later on.

Monday, August 22, 2005

Watching Market Sentiment Closely on Monday

The market closed out options week with indices resting on support and with indicators revealing oversold near term conditions. We need to see bulls make a stand here. A bounce at or very near current prices is almost assured. In order for it to be tradable on the long side, we need to see bulls step back in with volume. We are watching closely to see how stocks trade on Monday as this will surely give us a more accurate representation of the underlying sentiment of smart money. Options expiration, which is now behind us for another 4 weeks, always skews this sentiment.

Friday, August 19, 2005

Cash is King this Week

Trading conditions this week have been about as severe as we can recall from recent memory. Add to this the fact that market sentiment is skewed by today’s options expiration and the only logical conclusion to make is that all short term money should be in cash (gold may be an exception to this rule, but it needs to hold support at this level for this to remain true). The market is at a very precarious stage in its cycles. We had evaluated the QQQQ earlier this week and determined that it had more room to fall before finding trend support. It turns out however that what is true for the QQQQ is not in fact true for the NASDAQ or the S&P indices. These two indices have arrived at their battlegrounds and what occurs here will determine which side of the trade we need to be on for at least the next few weeks. The NASDAQ, as you can see from the chart below, closed slightly below its uptrend yesterday and is trading below its 3-year breakout highs. It must hold at the 50-day average and volume must come back in or the bears are going to have a hay day on a retest of the 2170 area.

The S&P is at an equally important line of last defense. It has broken its uptrend and is now trading at its 3-year breakout support. If its 50-day average breaks down here it will be time to start looking to position ourselves in short positions and defensive sectors.

Going into today, we take the technical threats these two indices are faced less seriously than normal. Options sellers have near perfect conditions under which to manipulate prices into their maximum pain levels and this week’s trading reveals that this is exactly what they have been doing. Today we await the outcome looking for volume and price to move higher or waiting for a slow drift and a breakdown. Either way, the uncertainty of this week will soon be behind us.

Thursday, August 18, 2005

Risk is Spiking in Front of Options Expiration

Near term conditions are oversold yet indices and a majority of the stocks in the market don’t have support yet either. Add to this serious volatility in the commodities sectors surrounding oil inventories, PPI numbers, the dollar’s dead cat rise, and then throw in options expiration into the mix; conditions could not get more risky. This market is a guessing game over the next few days. Further out we have a pretty good idea what we think is going to happen. We laid this out in yesterday’s report. What will happen over the next couple of days is another story. We had a handful of stocks show up in the scans with both long and short set ups. When market conditions are as unstable as they are right now though it is important to look at these set ups very skeptically. As much as we like to keep our money working for us, we just can’t find any better place to put that money to work that is better than cash right now. We may be stuck in this rut until at the very least tomorrow’s options expiration is out of the way.

Wednesday, August 17, 2005

Last Wednesday we provided a chart of the QQQQ (NASDAQ 100 ETF) projecting a minor trading range creating wave B in an ABC correction. Yesterday the B wave concluded and the projected C wave down began. Now realize that we take Elliot theory with a grain of salt and believe that its predictive power is more a myth swallowed by the true believers than it is a reality. However, sometimes patterns do repeat themselves in the market and when we are able to recognize this occurring it can lead to really great trading opportunities. So far the ABC correction we are now experiencing is mirroring the same type of correction that occurred during the month of June. It is too early yet to buy, but when the QQQQ hits its trend line at the $38-level it will be time to start buying the down days. We are looking for about a week of consolidation at the trend line so don’t get overly anxious looking for a quick bounce. Instead, use this as an opportunity to get positioned for what should be a strong move off of heavy support. The market is very oversold already and shorts are likely to pile on at this level. In our opinion it is too late to short for longer than a day trade, but the shorts that do enter at these levels will add much fuel to the reversal once the market hits support. Meanwhile, options week is playing havoc with the commodities sector and the dollar’s dead cat bounce from a deeply oversold condition has slowed momentum in the metals sectors. We believe this is temporary and that we will see the metals start to regain some momentum now that some of the pressure has been taken off of the dollar’s slide. The oil correction should lead to more buying opportunities since it has not yet created a topping pattern in a very strong trend.

Tuesday, August 16, 2005

One Day Up, One Day Down to Continue

The red bar, green bar trading range saga continues. Today’s low volume up day shouldn’t fool anyone. If the market stays true to its current character we expect today to be a down day, which should take indices and stocks back down to the bottom of the daily range. In other words, near the starting point of yesterday’s market. A few more days of this type of action appears to be in store and then we would expect a stab lower. If we can find a good short set up to take advantage of what is sure to be a very quick move lower, we will provide it. Right now there is so much neutrality in the market that finding the advantages becomes more of a guessing game and an exercise in futility. Never fear though. The market moves from cycles of inactivity to cycles of fast and furious activity.

Monday, August 15, 2005

Options Week Starts out Tepid

A couple of times last week we have brought up the fact that trading conditions are poor and that opening a new position under current conditions is inherently too risky at this time. Today conditions are as poor as ever. We continue to believe that shorts are at risk of getting squeezed while the market trades sideways or makes another attempt at recent highs. Longs risk false breakouts. Conditions right now are ripe for brokerage houses as commissions get churned, they are ripe for options sellers who look to profit as contracts expire worthless, and they are terrible for the rest of us. Hopefully a bias will work itself out one way or the other this week. There is at very least a strong potential that such a bias will present itself in gold and energy stocks. Energy could go either way here. We could see it undergo serious profit taking or we could see another explosive leg up.

Friday, August 12, 2005

Market Remains Flat

Risk remains high in the broader market and we continue to watch for a bear flag to develop followed by a leg down to support on the S&P 500 and the NASDAQ. The Dow looks to be basing at support and could surprise, quite possibly due to some of its energy stocks. We would love to be proven wrong and have the market turn higher here, but with oil continuing to push to new highs and with options expiration week next week, we are fairly confident that the market will trade sideways and then shake lower to rid it self of the last of the weak hands before it once again reverses. There were some momentum plays that came up in our scans today, so sell pressures are not heavy here. We would most likely characterize this market as having a lack of buying pressure as opposed to it undergoing smart money distribution, which was the case back in January.

Wednesday, August 10, 2005

Waiting Out the Correcting in Gold and Oil

Gold and oil continue to be the only truly viable up trends at this time. Going long in the broader market is most likely going to end up in frustration as the indices consolidate and grind lower. We believe that the second shoe will drop after losses are consolidated. This should take place over the next few weeks. After which we should have a very nice buying opportunity in place. The most likely scenario to play out will be an ABC correction in the broader market similar to that which took place in June. Take a look at the QQQQ chart below. We are projecting a “B” consolidation leg to form over the next week to week and a half. After which the second and final leg down should take the market back to support where a very nice buying opportunity should be at hand.

Tuesday, August 09, 2005

Waiting is the Best Strategy

It is too early to start thinking about buying the dips as the market works out a bottom. Even so, the indices and stocks alike are nearing near term oversold conditions and the put call ratio is nearing almost 2:1 puts to calls indicating an overly bearish sentiment reading. Contrarians consider readings as extreme as this an indication that a bottom or turn around is near. The sixty dollar question is will the reversal be tradable or will it be a weak countertrend rally that should be used to short into? At this point we don’t know. We will need to watch the volume on the reversal to determine if smart money is starting to move back in. If they don’t, it likely means that the countertrend rally is only luring in retail investors before the next leg down ensues. Gold is getting choppy as the dollar finds itself in its own countertrend rally. The dollar reversal does in fact appear to be a weak rally that is only letting off downside pressure before another leg down can take place. We expect gold to chop around and pretty much trade sideways while traders position themselves in the dollar for the next leg lower. Recently, when the dollar goes lower, gold will move higher. Oil does not appear to be done moving up yet and looks like it could potentially grind its way higher over the next week or two. Waiting another day or two for better conditions is by far the superior trading strategy at this point.

Friday, August 05, 2005

Until Further Notice, Stick with Gold and Oil

Yesterday's trading projects a correction in the broad market. So far however indicators on all counts are strong so unless that changes the correction should occur with a number of nice bullish divergences and should prove to not be a harsh correction. It’s early yet to predict. Gold stocks consolidated high yesterday and look to work on establishing a base of support for a higher move. We would prefer this to a quick and fast run up since such a run would only entice sellers to get aggressive. Slow and steady is our hope. Meanwhile, Thursday's oil weakness was just a minor setback in the trend it would appear. The XOI experienced another flat day, but several oil related stocks, including ENI, showed renewed strength. Going into the weekend here we suggest staying in the safe haven commodities; gold and oil.

Thursday, August 04, 2005

Gold Miners Breakout

Gold broke out firmly and on volume on the back of a weak dollar yesterday. Take a look at the XAU index below. The trend line represents the 5-year trend, which was temporarily breached. The breakout yesterday puts the price of gold mining stocks above the basing inverted head and shoulders-type pattern that had been formulating just above the long term trend. The two year correction that gold had been in may now be at its end and the next leg up has a very good chance of starting from this level.

Wednesday, August 03, 2005

Oil Up, the Market is Up

The semiconductor sector broke through its trading range into a higher high yesterday. Meanwhile energy is still heating up and taking gas and oil stocks higher. The broader market is overbought and risk is high at this stage but it’s awfully difficult to argue with progress. Breadth in the broader market was strong yesterday and volume on the rally was strong so we don’t think anyone can argue that this was a retail rally in which smart money did not participate. At this stage we will have to assume the uncomfortable position that we just don’t know what will occur next. If the semiconductor breakout was the real thing, there will still be time to get in tomorrow or the next day. Likewise, it will pull along trailing sectors which will start to build good breakout patterns as more money comes into the market. If the high price of oil scares the market back into “reality,” whatever that is, then waiting for confirmation will pay off to since less risk exposure will be assumed waiting on the sidelines.

Tuesday, August 02, 2005

Oil Ramps Higher

Oil prices are once again ramping up and as yet are showing no sign of letting up. It won’t find chart resistance until it hits close to the unthinkable price of $70 per barrel. This is reflected in the oil service stocks. The XOI index has been consolidating above its pivot point and is now poised to make a run for its upper resistance channel which beckons like a magnet.

Friday, July 29, 2005

Rally Needs a Rest

While we find ourselves nearing the end of earnings season and right in the middle of the end of the month buying window, trading conditions are very poor. Stocks and indices alike are extended and need to pull back and regroup. This month’s buying window may merely prop up indices rather than push them higher. Stocks are still breaking out, but with little conviction. Volume levels are drying up and the put/call ratio shows that bulls are overly eager, which means they are likely to feel some pain near term.

Thursday, July 28, 2005

Hesitation, but Odds Favor Longs

The market continues to be plagued by indecision as a result of a intermediate overbought condition and a plethora of earnings releases. Scans turned up very thin this morning with a few short set ups. We are very hesitant to jump to the short side for several reasons. Today starts the 5-day window that marks the end of the month buying spree where funds have new dollars coming in from retirement account deductions. Likewise, the trend is still up and choosing a market top is a recipe for disaster. Finally, if the market fails here, the countertrend rally will provide a much better risk/reward ratio than gambling here. We are betting that short positions put on here are going to provide fuel for the fire as end of the month buying kicks in. Short covering should propel indices and stocks higher over the next few days.

Tuesday, July 26, 2005

Pulling Back, but Weekly Breakout in Tact

Relying on the weekly charts we have to make the assumption that weakness experienced at the current level is nothing more than minor profit taking and consolidation. Surely shorts are being sucked in at these levels, but it is precisely this type of reaction that can and does propel a market higher. Shorts try and pick a top (a very difficult endeavor indeed) and when bulls retake their ground shorts cover their positions at a loss and the market propels higher. Again, the weekly breakouts we highlighted last week have not been compromised and technical indicators do not show serious distribution taking place yet so for the time being the risk/reward ratio favors the long side.

Monday, July 25, 2005

Strength in the Midst of Earnings

Scans turned up a strong underlying current from what would appear a lackluster close on Friday. A great number of stocks are setting up in nice tradable patterns. Unfortunately, we are forced to set the majority of them aside as we find ourselves caught dead center in the middle of earnings season.

Thursday, July 21, 2005

S&P Breakout has Significant Ramifications

If there is one constant in the market it is that the market constantly changes. Summer is supposed to lull traders to sleep as the market drifts on low volume. This year is different. We moved from a very poor year last year where volatility levels hit all time lows and trading accounts suffered drawdowns when breakouts and breakdowns failed to follow through. Now here we are in the middle of July and the S&P just broke out into a new 4-year high. Significant about this breakout is the fact that it doesn’t appear to be slowing down any time soon. The price action over the last week has pushed the index through a long term triple top pattern projecting significant growth over coming months. The NASDAQ has yet to test its overhead resistance, but the S&P is free and clear for some time to come. Under such conditions pullbacks become buying opportunities and breakouts tend to succeed at a significantly higher rate. Technically we can find no reason why this breakout could be false. It would take a fundamental change in the current market environment to slow down this momentum.