Securities Research Services

Thursday, May 29, 2008

Window Dressing Rally Continues

Today we want to take a look at where the SPY might be headed as the end of the month buying spree winds down.

Note on the daily chart below that the SPY broke down from a rising wedge pattern after testing the area of major resistance we have repeatedly pointed out over the past few weeks.
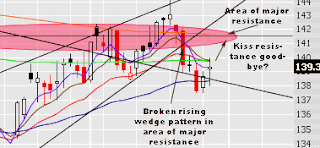
After a steep decline last week, the price found support at its flattening 50-day moving average. We have expected some sort of a bounce this week due to typical end of the month run ups that occur when fund managers buffer their portfolios by putting their extra cash to work for month end reporting statistics.

So far the bounce has been minor, but technical indicators reset to buy signals and it now looks probable that prices will run back up to the $141.50-$142.00 area where previously resistance took hold.

Now, we don't know what the future holds. All we can do is weigh the probabilities and try and determine the most likely outcome from those probabilities.

With that in mind, we will be watching to see how the market behaves when and if it reaches back to the area of major resistance that has thus far proven to be an area where massive supply has turned back rally attempts. An outcome we will be watching for is a kiss goodbye at resistance, which is a typical throwback pattern that often occurs once a major breakdown has occurred, which happened last week when the rising wedge pattern saw a high volume plunge through its lower band.

If prices reach back to this area and start to turn back, that will be the signal we are looking for to add to our short position added early last week.

Since we don't know the future, it is best to be prepared potential problems with the short position. If prices don't turn back from the $141.50-$142.00 area, we may see a situation where the market has shrugged off the selling pressure and where prices continue to rise as they ascend a wall of worry. While we don't expect this, it is something to be aware of and to be prepared for, which would entail covering short positions.

The bottom line here is that you will want to wait for confirmation, which would entail waiting for a failure at resistance before adding to your short positions. Risk:reward here continues to favor the short side, but if resistance fails, that would change. Flexibility and a position of agnosticism are essential to succeeding in the markets.
Tuesday, May 27, 2008

Weekly Sell Signal vs End of Month Window Dressing

SPY sold off hard last week from the resistance area we have been talking about for weeks now. Volume increased on the downturn and the SPY is now trending down on both a near term and long term basis, the ideal risk:reward situation for short trades.

Keep in mind that this week kicks off month end window dressing, so a minor bounce in the SPY is expected. With last week's heavy sell off, which created a bearish engulfing signal on a weekly basis, overhead resistance should keep any rallies in check not far above the current price.

Thursday, May 22, 2008

The True Trend Takes Hold

The Market finally revealed its hand yesterday and what it was holding is exactly what we have been projecting.

Trade opportunities have been slim recently, unless you were willing to take on extreme amounts of risk. We had recommended shorting the SPY in the current area reasoning that the price was likely to fail just above its 200-day average.

Indeed, the SPY tagged the upper band of its rising wedge pattern on Monday, gapped down to form a shooting star top on Tuesday, and yesterday sold off on the heaviest volume in 7 weeks, breaking down below the bearish rising wedge.

Fear spiked yesterday, so we may see a bounce over the next day or two. Any bounces are now selling opportunities.

Wednesday, May 21, 2008

Breakdown Watch In Effect

On Monday the SPY tagged the upper band of its rising wedge pattern and sold off toward daily lows. Yesterday, prices gapped down and traded in the red throughout the day. This has created a potential morning star sell signal on the chart.

What we need now is confirmation. Late in the day yesterday buyers came back in and the SPY continues to trade above support in the rising wedge pattern we continue to track.

What we are faced with here is a market that has extreme overhead resistance, but also a market that has not yet broken down. It would take a close below roughly $140.50 before we can call a clear breakdown in the uptrend. While that appears likely to happen sometime over the next 4-5 trading days it hasn't happened yet and until it does, it's best to avoid aggressive trades on either the short or the long sides.

Friday, May 16, 2008

Watching and Waiting For a Reversal

Options expire today, so consider the possibility that any move over the last day or two and today have more to do with parking the price into maximum pain than it has to do with real demand.

Don Worden writes today:

The only fly in the ointment today was the Dominant Price-Volume Relationship. Following two market days with no Dominant Relationship, today's session was dominated by 1163 stocks with Price-Up and Volume-Down. This is a bearish relationship in any kind of market. Today's reading implies that there is low and diminishing support underlying today's advance.


Meanwhile, the SPY finds itself trading in a rising wedge pattern. While it has seemingly breeched its 200-day average, it will run into upper resistance on the wedge pattern just slightly over $143. This fits nicely into the theory that this rally will end following a false 200-day average breakout.

Why do we expect a false breakout here?

First and foremost is the fact that the VIX is trading back at lows not achieved since October when the market rolled over. A low VIX level betrays complacency, and given the fact that we remain in a primary downtrend, a complacent rally into resistance does not inspire a great deal of confidence.

In addition, volume decreased on the move higher yesterday. If you add this to the fact that there is a bearish divergence in the advance/decline ration and then mix in the fact that technical indicators, including stochastics have moved to overbought, you have a recipe for a reversal.

Outlook:

With yesterday's break of the 200-day average, the target price for the SPY is now just slightly above $143. Shorting in this area offers a high probability of success.

Wednesday, May 14, 2008

Vacation Schedule

Staff is on vacation this week so updates will be a bit more sporadic.

The market has thus far failed to follow through lower, so as long as the near term trend holds, it does not pay to enter short positions. Meanwhile, oil and steel continue to offer potential upside.

Friday, May 09, 2008

Serious Selling Occuring in SPY

The SPY continues to struggle at resistance. It hasn't yet broken through the near term uptrend channel mentioned in yesterday's report, but it is probably only a matter of time.

As you can see in the chart above, the price is struggling against the long term downtrend line, which also converges at broken support from last January. A large number of investors bought into this market above $142. These same investors, including large institutional players, have been waiting for an opportunity to cut their losses, which means that there is a huge supply of sellers in this area.

The only real question that remains is will we get another minor bounce back to $140-$141 that fails, or will the near term uptrend fail here?

:
:
Outlook:

It's unclear whether a price failure in this area will lead to an extended decline that ultimately takes out $126 or if a failure here will merely lead to a minor decline that soon stabilizes (perhaps in the $137 50-day average area). It is fairly clear though that a serious top was reached this week.

Thursday, May 08, 2008

Sell in May and Go Away?

The SPY, after finding massive resistance at its 200-day average, dropped down to the bottom of its price channel, which represents support for the near term uptrend.

Volume wasn't spectacular, so there are no guarantees it will break through this support area right away. We may or may not get a minor bounce here.

Two things are clear though. First, any reattempt at the 200-day average offers an excellent shorting opportunity. Second, when the price does break through the floor of this price channel, look out below as the selling is likely to be fast and furious.

Outlook:

A breakout appears unlikely as the bull trap appears to have been set. We suspect that any early buying now will be faded as smart money puts on short positions.

Wednesday, May 07, 2008

Nothing Changed Yesterday

Nothing changed yesterday. The S&P is bound and determined to attempt higher prices. Risk remains extreme. We continue to recommend a focus on Steel, Agriculture, and Oil. There are some very nice long side set ups here, while the broader market looks more like a sucker's rally than a reason to get excited.

Tuesday, May 06, 2008

Focus On Oil While the Market Makes Up Its Mind

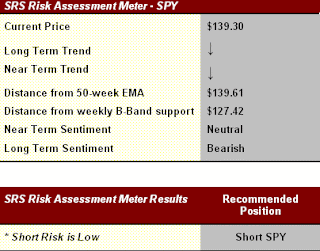
As you can see from the risk table below, the risk of a major reversal is extremely high at current levels. Even so, it is best to wait for confirmation before betting on a downturn. The near term trend remains up, and while the bulls face probabilities that are strongly against them, it is unwise to fight the tape of the near term trend.

If and when it turns there should be plenty of opportunity to reestablish short positions.

Meanwhile, oil rocketed higher again out of a thrust pullback from last week. Volume was strong and no glaring divergences exist, which should give oil bulls pause here.

Outlook:

The outlook here can't be known until the market confirms one way or the other. Risk is high and we would think that the market is apt to roll over somewhere near here with prices facing major resistance and with traders bullish again, but anything can and often does happen in the market, so we recommend keeping your money sidelined until the risk:reward situation improves with a confirmation.

Rising prices on bad breadth and increasing bullish sentiment is not a recipe for sustainability.

Keep in mind, that while we are recommending a cash position on the broader market, that there remain opportunities on the long side in the oil sector, where the bull continues to stomp and snort.

Monday, May 05, 2008

A Cash Position Is Recommended Here

Over the past few weeks we have outlined a couple of different scenarios which the market could reasonably be expected to do moving forward. One scenario was that the SPY would get rejected at its falling trend line nullifying the breakout at $137.

When prices turned sharply lower following the Fed rate cut last week, it certainly looked for all intents and purposes to be rolling over at the trend line. On Thursday, however, prices whipsawed higher, catching a lot of traders, including us, wrongly positioned.

On Friday prices shot up to tag the 200-day average in the $142 area. This was the second scenario we have recently discussed, which we thought might play out.

Now the question is, now that the market has tagged the 200-day average, does it roll back over on its way to making lower bear market lows? Does it tease us for a few days, breaking slightly higher, but on decreasing volume? Or, and here is a possibility we haven't considered yet, does it make a run against all odds back up to the $146-$147 area on its way to attempt a test at last year's highs?

At this point, all is possible and nothing is probable. We are at one of those junctures that the market likes to set up every so often where it is just not showing its hand. In other words, probabilities are very poor for making new bets here.

What we are sure about is that if prices are bound and determined to run higher here, there will be time to reenter the strongest stocks for a ride higher. And, if prices are bound and determined to fail near here, there will be time to enter once this failure has confirmed.

Confirmation is key to putting the probabilities in your favor here. We need to see either a price failure or we need to see stocks move up higher out of their bases on good volume before putting money to work in this market again.

Summary: Confirmation of a failure means prices sell off on increased volume from the current area. Confirmation of a breakout means we see prices move higher as volume increases. Anything less than these two situations means the market is still teasing and not showing her full hand.

Outlook:

The outlook here can't be known until the market confirms one way or the other. Risk is high and we would think that the market is apt to roll over somewhere near here with prices facing major resistance and with traders bullish again, but anything can and often does happen in the market, so we recommend keeping your money sidelined until the risk:reward situation improves with a confirmation.

Rising prices on bad breadth and increasing bullish sentiment is not a recipe for sustainability.

Thursday, May 01, 2008

Downtrend Line Kissed Goodbye

Let's start off today with a recap of our recent analysis over the past few weeks. We have argued that the long term trend for the broader market is down, though the short term trend has been up. We also argued that when the SPY price moved up into the red zone on the charts we have been providing that the risk of reversal was extremely high.

Moving on…

Monday we noted that while the SPY still had some major resistance to deal with and that while a reversal was likely, that we had seen money flowing into the oils, steel, rail, and ag.

There has been little doubt that the SPY would turn back somewhere near its current trading zone, but it was unclear whether or not a bull trap would be set by a false breakout to the $141-$142 area.

Yesterday's reaction to the rate cut clears up a few things for us.

First, the money moving into the commodities represents the fact that traders were betting on a Fed that would cut interest rates, further exacerbating inflation in these sectors; indeed, they were correct.

Second, it now looks like the SPY is going to have a tough time setting up the bear trap scenario. With the inflation friendly rate cut the SPY sold off after tagging its falling downtrend. Not only did it sell off, but it did so on much stronger volume than the tiny breakout from last week has enjoyed.

It's pretty clear here that the market views the rate cut as damaging to the economy, which is already suffering from high gas, food, and other commodity prices.

One major question still is left unanswered, but we suspect we will get the answer real soon; when the broader market sells off, will it create a buying opportunity in the commodities as fund managers unload in a panic, or will commodities survive the panic this round and continue their journey higher unabated?

Outlook:

A bull trap breakout appears unlikely. We suspect that any early buying now will be faded as smart money puts on short positions.