Also note the important break in the uptrend line yesterday, even as QQQQ shares traded higher. Adding insult to injury, the S&P 500 made a new 5-year high yesterday, while the NASDAQ lagged significantly. This type of bearish divergence has preceded each failed rally for several years now. Gaming Window Dressers: End of month window dressing has been increasingly gamed by traders who have learned the pattern. Not that long ago window dressing would result in rallies which took place during the last three days of the month, and sometimes extended into the first two trading days of the following month. Now, however, traders have been taking advantage of the rallies and selling into them during the later days, causing the rallies to start to fizzle during the last day or two of the month. If this pattern persists, it means that today should market the last day where window dressing is able to push the market higher. S&P Rising Wedge: One of the most bearish of all rally patterns is the rising wedge, a pattern we have highlighted several times over the past few weeks in the S&P 500 index. We have hypothesized that before this wedge gives way to selling, a strong upside breakout would occur in order to draw in bag holders. Yesterday we got the initial move of just such a breakout, as can be seen below.
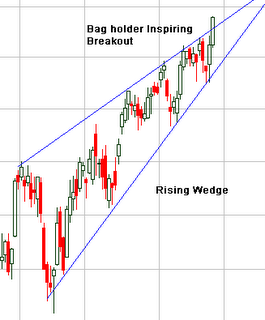
Window dressing may take this breakout up another day, perhaps two, but we argue that this breakout is very likely a bull trap, which will fail only to send the index tumbling back down to July lows during the month of October. Of course this last point is only speculation, but the rising wedge pattern is fairly predictable and given the divergence with the NASDAQ, the emini sell signal, and the fact that the 4-year Cycle low has not yet exerted its pressure, we think there are some pretty good reasons to take a seriously defensive posture starting this week. Once current buyers walk away and sellers are left without competition, this market can come down fast.Our stock trading strategies are based on surprisingly simple yet effective no nonsense logic that is uncommon in the stock market. For our short term trading strategy we: Buy at support; we take small, quick profits; and we use the 10/2 rule so that we never slip backwards.
Wednesday, September 27, 2006
Time for Caution
In August, right before the market began to rally, we ignored an important buy signal in lieu of chart and volume patterns, which indicated more downside. Because we ignored this signal, we were caught on the wrong side of the trade. Now, interestingly enough, we are getting the same signal, only this time in reverse.
NASDAQ 100 emini Sell Signal: At the beginning of August, futures markets for the NASDAQ 100 emini contract showed a breakout in money flow, which preceded the breakout stocks. Now the same contract has a money flow indicator that reveals smart money selling into the current rally.
Subscribe to:
Post Comments (Atom)
No comments:
Post a Comment