Securities Research Services

Wednesday, November 30, 2005

Pullback Likely Nearly Played Out

The pullback continued yesterday. We wouldn't be surprised to see the market shake lower this morning and then resume the uptrend with a higher close creating a reversal hammer. Remember the fact that we are just entering the month end buying window and buying pressures have been heavy even after seasonal trends have been accounted for. Many of the minor indices were showing strength yesterday as end of the month buying pressures supported them. The Russell 2000 index in particular looks strong and underlying stocks are showing support.

Monday, November 28, 2005

Bracing for a Pull Back

As could be expected, Friday's short trading day occurred on very light volume. There is not much to be gained by trying to analyze performance on this slow holiday weekend trade day. Longer term charts are in very healthy conditions and investment dynamics at this stage support a long term rally to continue. Short term however we should expect a pullback. It is very likely we will get a harsh retracement at some point this week, which will serve to shake out the weak hands. Dips continue to be buying opportunities but dips can also increase the risk on short term trades. The positive side to the equation is that pullbacks help reveal where the strength and weakness is. During rallies all ships (or in this instance stocks) rise with the tide of the rising market. During pullbacks the strongest stocks will do a better job at holding support levels while weaker stocks get hit the hardest. This is because profits from weak stocks are redistributed into stronger stocks. In the long run this will give us a clearer picture where to distribute our money to get the best risk/reward.

Wednesday, November 23, 2005

The Fed Blinks

The big news of the day, and perhaps the explanation for why market participants are wearing their rally hats came from the Fed. Yesterday's Fed notes strongly indicated that the magical word "measured," as in measured rate hikes, will be removed from the next official release. The consensus is that after two more hikes the Fed will stop raising rates at 4.50%. This is an explosive development that will surely bolster the year end rally and quite possibly extend it well into next year. Despite massively overbought conditions, a "get in at all costs" temperament has taken over Wall Street. Don't fight the trend here, but be assured what comes up will come down. The market has the potential to tack on some serious gains as we close out the year and don't be fooled, this is all very bullish action. Even so, the market NEVER goes straight up so we will eventually get a pullback that will shake loose a lot of trading positions. Trailing stops and small share sizes are the best way to play this market until we get a reasonable pullback.

Tuesday, November 22, 2005

Holiday Week, Trending Higher

Volume will be even lower the rest of the week. Traders can potentially use this as an opportunity to chase prices higher. Areas of tech were weak yesterday, but pullbacks in this type of market environment are usually short lived as they lure in bearish traders and then quickly resume their trends. We can't repeat this enough, dips are buying opportunities now.

Sunday, November 20, 2005

Now is the Time to Buy; Most Will Miss it

Now is the time to be fully invested in the market. We repeat, now is the time to be fully invested. Talking heads on the financial channels are going to continue to focus on reasons why consumers should be worried. Perma bears are going to continue to try and focus your attention on the negatives out there all the time ignoring the positives. We let price do the talking and price is telling us that opportunities that have been elusive since March 2004 now abound. Did you know that most individual investors were very bearish during the 1982-1987 bull market and statistics show they were net sellers of stock during that entire bull market.

Again, during the 1990-2000 bull market, the first half of that period was characterized by individuals selling their stocks. It was only during the 1995-2000 period in which individuals were net buyers of stocks.

Are you frustrated with lack of performance in your portfolio over the past year? Cheer up, price and volume are telling us that the future is good. More importantly, they are telling us that right here, right now is just the beginning of the next bull market move. Smart money understands this just like they did in 1982 and again in 1995. The average consumer misses the best opportunities and either comes to the party late or doesn't come at all. Here is why the party is just getting started: After two years of a grueling sideways trading range, the NASDAQ 100 has broken out:

After two years of a grueling sideways trading range, the S&P 500 has broken out:

If history repeats itself once again, then those who recognize this opportunity while it's still in its youth will be in the minority. Don't be in the crowd of sheep who will miss this screaming buy signal.

Thursday, November 17, 2005

Watching for a Gold Miner Breakout

In January of 2003 the XAU (gold and silver index) had a weekly peak close of $111.33, following which, it took a long slide down to the $70s. After several months of recovery it once again peaked for a weekly close of $109.68 in November 2004. It again slid back down to the $70 range. Now we are back up at this resistance level. At the end of August a peak weekly closing price of $112.92 was logged. This time the price did not slide back to the $70 range though. Yesterday the XAU closed at $114.29. This represents a breakout on the weekly charts IF the price does not reverse before Friday's bell. Gold and silver stocks we track have been consolidating and breaking out on heavy volume. Yesterday was the most dramatic action this sector has seen in some time. Gold and silver are not free and clear to run yet, but there is a very good chance that this week may be the week that the sector breaks out allowing stocks to finally run. Note: Cash silver made an 11-month high yesterday and did in fact break above its long term overhead resistance level. The stock market is still dealing with options expiration, so we don't expect to see much more action in the broader market until next week.

Wednesday, November 16, 2005

Dips Remain Buying Oportunities, But Wait

Options week volatility is a bit exaggerated this month as indices continue to be overbought. Yesterday was more of a buyer's strike than it was a sell off. Profits on the table after the recent run up can disappear quickly even in a minor pullback so there was a bit of panic profit taking yesterday afternoon. The area to keep an eye on here is the semiconductors, which have been one of the main market leaders in the recent rally. The SMH reversed sharply yesterday and the closing price left a fairly strong near term sell signal. 
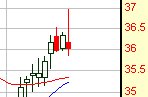
As you can see, the QQQQ is still well above its breakout point and maximum pain for call buyers is $40. The intraday reversal on the QQQQ yesterday strengthens the chances of options sellers to get the QQQQ down to maximum pain by Friday where they will realize the most profit on their contracts. Such a pullback would be healthy as we believe buyers who missed the breakout are waiting back at the $40 area for a second chance to participate in this rally.

There is little doubt that the market is going to pull back here. We believe that the best position to take during this pullback is a defensive one. There are possibly some positions that are shortable, but risk of surprise generally occurs in the direction of the trend. Since the trend is up, risk on the short side is not manageable for all but the most nimble of traders. After market shocks might be the biggest reason for avoiding short positions at this point.

We may suffer some stop outs as a result of yesterday's hard reversal. Respect the pullback and honor stops here. Buying opportunities are sure to arise out of this pullback, but the next few days are the time to preserve your trading account, not hold and hope.

Tuesday, November 15, 2005

2nd Tier Stocks Under Accumulation

Accumulation continues at these vaulted levels and market indices are working off their overbought conditions by trading sideways rather than pulling back. This is because dips are being purchased by those who missed the breakout. Poor volume levels are positive for bulls at this point as it means that bears are not acting aggressively, even in front of options expiration on Friday. Scans continue to reveal improving underlying conditions as second tier issues are now under accumulation as profits are redistributed.

Monday, November 14, 2005

Dips Are Buying Opportunities

Everyone is calling for a pullback here, which we may very well get. In this market environment shorts and institutional longs are going to start screaming "false breakout" to get you to jump in with them or to get you to give up your shares. Don't listen to them. Dips are buying opportunities here. The market, and tech sector especially, has broken out and everything is lined up for higher prices in the future. Unless a fundamental change is introduced into the market here, such as a massive spike in oil prices, this breakout is firmly in tact. As you should expect to find in a bull market, even as indices are ready to pull back, second tier stocks are just now breaking out. Scans revealed a pattern of good chart set ups unlike anything we have found in many months. Don't forget however that this is options expiration week so volatility is likely to be up sharply.

Thursday, November 10, 2005

Gold Miners To Retest Resistance

The broad market has moved into a sideways trading range. This should last for a few more days at least. This is a healthy way for indices and stocks alike to work off their technically overbought condition and is a very bullish development. As we stated yesterday, stay patient and wait for the opportunities that are sure to arrive. Gold miners meanwhile, which have been looking rather weak lately, moved strongly off their long term trend and the XAU is ready to make another go at overhead resistance. We believe there is a very good chance that this time will be the one where the miners break out of their long term trading range and move into new territory. We won't know for sure until resistance is tested and broken, but right here is where risk is lowest. Once the price breaks out, it will be much harder to find an entry.

Wednesday, November 09, 2005

Patience Will Win

The market is necessarily in the process of working off its overbought condition. At this point stocks look to slightly retrace or trade in place. It is impossible to project how long this process will take to work out, but until it does trading is likely to be fairly boring. We fully expect the market to make another leg higher from the move started mid October. It is important to keep the big picture in mind and stay patient as we wait for good set ups to emerge. Currently a few sectors, such as gold and utilities, look to break down creating some shorting opportunities. Nevertheless, we believe the real advantages in this current environment are to be found on the long side. It would be better to keep cash ready to deploy once the market starts moving again rather than trying to force a difficult countertrend trade on the short side in the weakest sectors. We have booked some nice profits recently and we expect to add to those gains so we ask everyone to remain patient as we let this very healthy consolidation process work itself out.

Tuesday, November 08, 2005

The Pause Which Refreshes

Indices paused yesterday, which is frankly a relief. The last thing we needed at this point is for the bulls to get overly anxious and run prices so high that shorts once again gain an advantage. What we would like to see here, and what we expect, is a little base building. The QQQQ charged straight off of $38 without a pullback. Sideways trading, or even a pullback to support at $39.50 would give the QQQQ a strong base for a launch higher. There are a lot of traders and investors on the sidelines now that did not anticipate this move, so expect the dips to find quick support.

Monday, November 07, 2005

Tech Leadership Breaks Out!

Once again, take a look at the QQQQ chart: What we have anticipated and have been highlighting since September has finally happened. The upper resistance line on the QQQQ has been broken on a weekly basis. Confirming the breakout is the SMH (semiconductor sector), which bounced firmly off long term support and is now embarking on the next leg up in its long term uptrend. The Dow and S&P broke above their pullback resistance levels and are also in confirmed up trends. This is a market that is firing on all cylinders. This is a market that we anticipate will provide opportunities not enjoyed since the year 2003.

Thursday, November 03, 2005

Nasdaq 100 Testing Breakout Levels

Take a look at yesterday’s QQQQ chart:

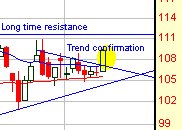
It broke downtrend resistance at $39 on heavy volume and closed just below the all-important $39.50. We mentioned these two numbers in yesterday’s report. Moving over $39 should be considered a breakout and bears have their backs against the wall here as money that has been sidelined for months is starting to come in. Investors are starting to get worried that they are going to miss a 4th quarter rally, as well they should.

The real test is yet to come however. $39.50 represents resistance drawn from October 2004’s peak (see weekly chart above). In fact, this basic level has represented overhead supply (resistance) since January of 2004. A strong break above $39.50 would put us into a new bullish era that could last for a couple of years. More importantly, it would take us out of the grueling trading range that for the past year and a half has made it very difficult to take money out of the market and that has led to periods of trading account draw downs. A sustained move over $39.50 would be significant indeed.

What has been holding back a tech break out? The weak semiconductor sector has. Take a look at the SMH chart below and notice the very strong bounce off its long term uptrend. This sector is ready to rally in the 4th quarter and we should see some nice gains to the upside starting from this move.

Wednesday, November 02, 2005

Weekly Likely to be Slow in Front of Employment Report Friday

It is tough to keep a near term bullish outlook after today’s scans. The intermediate outlook still remains bullish, but for the rest of this week bulls have their work cut out for them. The QQQQ has immediate overhead resistance at $39 and support at $38. We will be surprised if it bumps over $39 in front of Friday’s employment report, more likely it will drift back toward $38 support. One of the reasons we believe this is a possibility is due to the once again weak semiconductor sector, which is again heavily testing its long term trend. The SMH must hold $33 or things could get ugly for a few weeks.

Tuesday, November 01, 2005

Monday's Follow Through Confirms the Reversal

After yesterday’s follow through day we can breath a bit easier as the trend works to establish itself. There remains risk that yesterday’s gains will erode today as the day traders have “learned” over the past two weeks to aggressively sell the rallies on the following day. Nevertheless, we believe that prices will become more stable and that the overhead resistance levels on the major indices will once again be tested in coming weeks. This is a market heading for something big. Increased volatility indicates we are heading for a large break out or large break down in the next few months. The charts favor a break to the upside at this point.