The broader market continues to consolidate recent gains and recent red bar/green bar up and down days are likely to continue for a few more days at least.
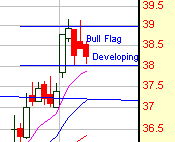
One of the better leading indicators for the health of the economy is the semiconductor sector. We believe that this sector is in the early stages of forming a bullish flag pattern. A bull flag is formed after a breakout and serves to work off oversold technical conditions and to create a higher base of support. The implications are in fact bullish due to the fact that profit takers are unable to effect a significant price drop as buyers continue to accumulate shares at the lower end of the range.

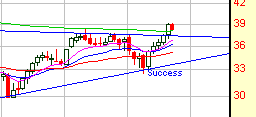
To support the argument that the SMH (Semiconductor Holders - above) is undergoing consolidation and not something more you need to pull back to the weekly chart.

From this view it is clearly seen that the price has broken above significant resistance and is merely taking a rest before continuing higher. The green line represents its 200-week average, territory the semiconductors have not enjoyed since the tech bear market began in the year 2000.
Not only is a recapture of this territory bullish, but it represents an objective way to measure the beginning of a new bull market in the sector. We believe that we are very close to the point of recognition when serious bears that have been short this year finally capitulate and move to the bullish camp. We believe that a break up from this bull flag could be the catalyst that will convince them to do so. When this happens the market is going to spring forward to dramatic new heights.


No comments:
Post a Comment