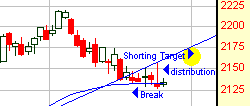
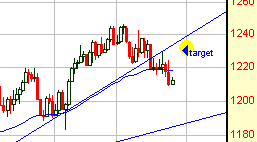
August has watched the market chop up and down making it difficult to predict direction. This week however we experienced a clear distribution signal as both the NASDAQ and S&P sold below their trend lines on heavy volume. Currently the market is very oversold and clearly we are due for some sort of bounce. Wednesday’s sell off however was a warning shot across the bow for the bulls. We argue that smart money has been using choppy trading this month to sell off the tops wearing out the ammunition bulls had in their arsenal. This means that any rally that begins from current levels will do so with odds favorably against its success.
Let’s take a look at the NASDAQ and S&P charts so that we can see what stocks are up against here.
While the NASDAQ 100 broke its trend only this week, the NASDAQ itself chopped through its trend over a week ago. On Wednesday it tried to recover, but instead experienced a strong distribution day. Keep in mind that it is very oversold here and due for a larger bounce. We argue that that larger bounce will only take it to the under belly of its broken trend where it will face daunting resistance. When it does return to the broken trend it is likely going to be a very nice short.

The S&P is in much worse shape, but the scenario is the same. We are looking for an oversold bounce to take it back to its broken trend. This will set up a short opportunity.

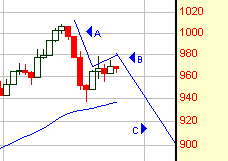
Now let’s take a look at the oil sector. We’ve been mentioning this week that it looks to be working out a topping pattern. Oil prices experienced a sharp correction last week and have since merely moved back up weakly in what we believe to be the “B” leg of an A, B, C downward correction. Prices could move slightly higher from here, but they are under pressure and are very likely to experience a heavy amount of resistance at current levels. Why? Markets forming tops after a strong trend often have a sharp sell-off and then make one last attempt to resume their longer term uptrend. This resumption is caused by bargain hunters buying at what they perceive to be low levels and by shorts taking profits (buying to cover). And, it can be accelerated by shorts being squeezed out. However, this action often exhausts itself before the market makes it back to its old highs. When this occurs, a true top is then formed. The chart below is of the oil services index, XOI and the pattern described here fits this chart very well.


No comments:
Post a Comment