As most of you are aware the stock market has many different trends occurring simultaneously. Which direction the market is trending depends on the time frame you are analyzing. This is always an important distinction to make and it is particularly important to have a big picture view but equally important to know your time frame.
After Friday's crash we have to operate under the assumption that the immediate daily trend is down keeping in mind that the weekly trend remains up. This is easier to understand visually, so we are providing a couple of different chart views analyzing the QQQQ.
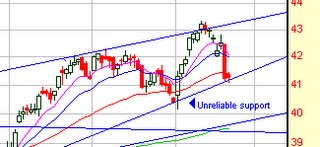
Note that the daily price on the QQQQ found overhead resistance at $43. After pulling back from this level there was some chance that resistance would be broken through on a second attempt. On Friday this attempt failed however and an immediate downtrend was established. There is some support below Friday's low, but it is unreliable as a trading level. The trend is our friend and the short term trend is now down. Current support will likely provide an area where the indices will weakly bounce in a counter trend move. This counter trend move should set up a nice short entry.
For those concerned that a bearish trend means a bearish market, fears of this sort are unfounded at this time. The weekly trend remains up as you can see from the QQQQ's weekly chart. Bears have very likely targeted the open gap at $39.50 and now that they have a trend in their favor they are going to be fairly aggressive about getting their target. A move back to this level would set up a wonderful buying opportunity in the longer term up trend.
The bottom line is that long positions in the general market are going to struggle near term but long term positions should be in good shape for the foreseeable future. Also keep in mind that bull markets in oil and precious metals are still in tact and still strong.
No comments:
Post a Comment