Tuesday, October 24, 2006
Dip Buying Remains Strong


Monday, October 23, 2006
Trends are Bullish, but Extended
Thursday, October 19, 2006
Dip Buyers Continue to be Relentless
Wednesday, October 18, 2006
Waiting on the CPI Reaction
Tuesday, October 17, 2006
Be Slow to Become Bearish
Monday, October 16, 2006
Charts are Great, but Protect Your Gains
 Second, just because resistance is overhead and indices are not likely to make much progress, trade what is in front of you. If set ups are good, take them and protect yourself with a good stop loss strategy. Right now set ups are very good. Yes prices may turn at any time, but no one made any progress in the market worrying about what "could" happen. You have to take the opportunities that the market gives you and protect yourself against the turns by using good risk management.
Friday, October 13, 2006
Next Friday's Expiration May Cause Shorts Pain
Thursday, October 12, 2006
The Trend Remains Long Friendly
Wednesday, October 11, 2006
Keeping the Big Picture in Mind as the Market Climbs

Tuesday, October 10, 2006
No Update Today
Monday, October 09, 2006
Bulls in Control, but This is Their End Game
Friday, October 06, 2006
Why Wednesday's Changed the Outlook
Thursday, October 05, 2006
Bulls Deliver a Potential Knockout Blow
Wednesday, October 04, 2006
Is a Rising Dow Bullish?
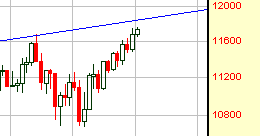
Note that the QQQQ accomplished the first leg (the up arrow) in the scenario provided yesterday. Now we wait to see if it will indeed be turned back at this area.

Tuesday, October 03, 2006
Bulls and Bears Likely to Be Frustrated this Week
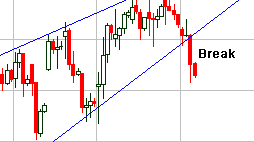
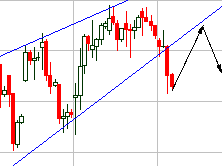
Second, too many traders have been waiting for this break and put options sales were through the roof yesterday as a result of the break. When too many people in the market are looking for the same thing, the perverse nature of the market is to deny the crowds their satisfaction. We scanned everything today and there are just not good chart set ups out there despite the QQQQ breakdown yesterday. Longs are very likely to be frustrated as rally attempts should now get turned back at resistance. Likewise, eager shorts are likely to be frustrated today as follow through from yesterday's breakdown is unlikely. Very often when a major breakdown occurs, the underside of support is tested before the trend can establish itself. Evidence points to a test of resistance that gives false courage to bulls and frustrates overly anticipatory bears before the market can move lower.
Monday, October 02, 2006
Friday Was Probably Meaningless
Friday, September 29, 2006
Sentiment Readings Near Dangerous Levels
Thursday, September 28, 2006
Selling Tech
 For the second week in a row the SMH has been rejected at $35. Yesterday's hard reversal and failure to bounce at the end of the day even as the broader market recovered somewhat, is the canary in the mine that has stopped singing. This sector is the leading indicator for the broader tech sector and this sector tells us that tech is weak.
Tops take time to form, but while the blue chips are working out their top, we suspect that, like the last top in April the QQQQ will start to come down early.
For the second week in a row the SMH has been rejected at $35. Yesterday's hard reversal and failure to bounce at the end of the day even as the broader market recovered somewhat, is the canary in the mine that has stopped singing. This sector is the leading indicator for the broader tech sector and this sector tells us that tech is weak.
Tops take time to form, but while the blue chips are working out their top, we suspect that, like the last top in April the QQQQ will start to come down early.
Wednesday, September 27, 2006
Time for Caution

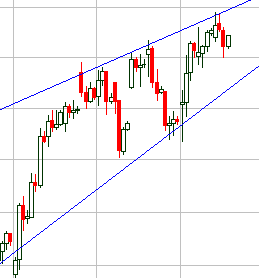
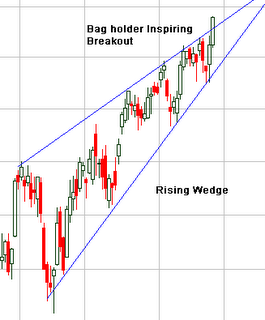
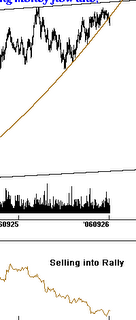
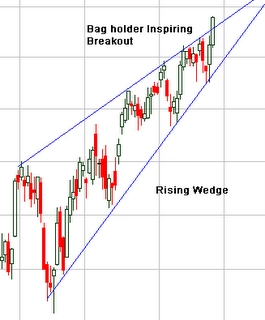
Also note the important break in the uptrend line yesterday, even as QQQQ shares traded higher. Adding insult to injury, the S&P 500 made a new 5-year high yesterday, while the NASDAQ lagged significantly. This type of bearish divergence has preceded each failed rally for several years now. Gaming Window Dressers: End of month window dressing has been increasingly gamed by traders who have learned the pattern. Not that long ago window dressing would result in rallies which took place during the last three days of the month, and sometimes extended into the first two trading days of the following month. Now, however, traders have been taking advantage of the rallies and selling into them during the later days, causing the rallies to start to fizzle during the last day or two of the month. If this pattern persists, it means that today should market the last day where window dressing is able to push the market higher. S&P Rising Wedge: One of the most bearish of all rally patterns is the rising wedge, a pattern we have highlighted several times over the past few weeks in the S&P 500 index. We have hypothesized that before this wedge gives way to selling, a strong upside breakout would occur in order to draw in bag holders. Yesterday we got the initial move of just such a breakout, as can be seen below.
Time for Caution
Also note the important break in the uptrend line yesterday, even as QQQQ shares traded higher. Adding insult to injury, the S&P 500 made a new 5-year high yesterday, while the NASDAQ lagged significantly. This type of bearish divergence has preceded each failed rally for several years now. Gaming Window Dressers: End of month window dressing has been increasingly gamed by traders who have learned the pattern. Not that long ago window dressing would result in rallies which took place during the last three days of the month, and sometimes extended into the first two trading days of the following month. Now, however, traders have been taking advantage of the rallies and selling into them during the later days, causing the rallies to start to fizzle during the last day or two of the month. If this pattern persists, it means that today should market the last day where window dressing is able to push the market higher. S&P Rising Wedge: One of the most bearish of all rally patterns is the rising wedge, a pattern we have highlighted several times over the past few weeks in the S&P 500 index. We have hypothesized that before this wedge gives way to selling, a strong upside breakout would occur in order to draw in bag holders. Yesterday we got the initial move of just such a breakout, as can be seen below.
Tuesday, September 26, 2006
As Long as Everyone is Bearish, This Rise Will Continue
Monday, September 25, 2006
Window Dressing Should Prop Up Weak Market
 There remains potential for the S&P to test its highs this week. We will be surprised, but not completely shocked, if the QQQQ is able to also test its highs. We would use late week strength to look for short positions.
Finally, for those feeling a twitch of concern at our market outlook, consider that after a corrective retracement, the probabilities for a strong late year rally are very good.
There remains potential for the S&P to test its highs this week. We will be surprised, but not completely shocked, if the QQQQ is able to also test its highs. We would use late week strength to look for short positions.
Finally, for those feeling a twitch of concern at our market outlook, consider that after a corrective retracement, the probabilities for a strong late year rally are very good.
Friday, September 22, 2006
Market Cracks Some More
Thursday, September 21, 2006
SMH Fails to Make a New High
Wednesday, September 20, 2006
Monday's Scenario Still In Play
Tuesday, September 19, 2006
Buyers Still in Control/Tech May Have a Top
Monday, September 18, 2006
Support Test Coming Up
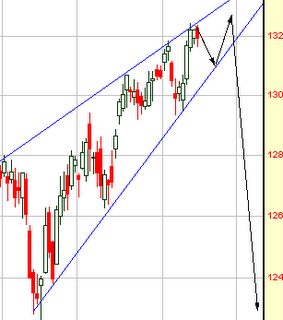 The QQQQ set up is a little more unclear as it has shown good relative strength lately.
The bottom line: We are seeing some good long set ups at this time that should continue higher over the next couple of weeks. As we enter October the market becomes more vulnerable to a larger correction. Should the above scenario play out like it looks like it might, the return to the summer lows will provide an excellent long term buying opportunity. Participants are likely to be extremely bearish at that point and those who play it cautious as the market makes its top here will be in great shape to capitalize at very good prices indeed.
The QQQQ set up is a little more unclear as it has shown good relative strength lately.
The bottom line: We are seeing some good long set ups at this time that should continue higher over the next couple of weeks. As we enter October the market becomes more vulnerable to a larger correction. Should the above scenario play out like it looks like it might, the return to the summer lows will provide an excellent long term buying opportunity. Participants are likely to be extremely bearish at that point and those who play it cautious as the market makes its top here will be in great shape to capitalize at very good prices indeed.
Friday, September 15, 2006
Watching and Waiting
Thursday, September 14, 2006
Pavlov's Lesson
Wednesday, September 13, 2006
Bulls Refuse to Give Up
Tuesday, September 12, 2006
Watching Tech's Head and Shoulders
Monday, September 11, 2006
Three Potential QQQQ Scenarios
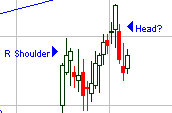
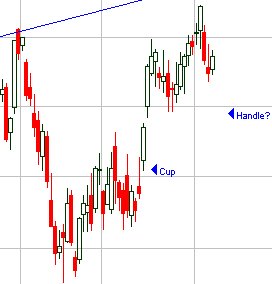
If this is indeed the case, we should see the price bounce around between $38.00-$38.70 through options expiration, and then potentially break lower. Cup and Handle (bullish)
Friday, September 08, 2006
No Advantages to Forcing a Trade
Thursday, September 07, 2006
Stay Patient, Sentiment Will Swing Again
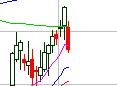 The tech sector will probably bounce from yesterday's lows, but now any rally attempts are very likely to get stuck in the mud and prices will begin working their way lower; frustrating any hopeful longs who buy the dips.
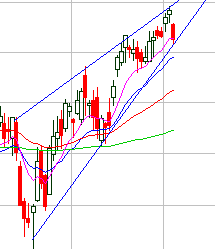
The SPY (S&P 500) moved down to support yesterday, but it has not yet provided a sell signal. Money flow perked up at the end of the day indicating that smart money has not yet determined that the rally is completely played out. There are just too many retail traders who have quickly jumped to the bear camp after yesterday's weakness. The market's perverse nature is likely to frustrate put option buyers by failing to provide immediate gratification.
If the SPY can break below the blue uptrend line it closed at yesterday, it will signal a sell.
The tech sector will probably bounce from yesterday's lows, but now any rally attempts are very likely to get stuck in the mud and prices will begin working their way lower; frustrating any hopeful longs who buy the dips.
The SPY (S&P 500) moved down to support yesterday, but it has not yet provided a sell signal. Money flow perked up at the end of the day indicating that smart money has not yet determined that the rally is completely played out. There are just too many retail traders who have quickly jumped to the bear camp after yesterday's weakness. The market's perverse nature is likely to frustrate put option buyers by failing to provide immediate gratification.
If the SPY can break below the blue uptrend line it closed at yesterday, it will signal a sell.
Wednesday, September 06, 2006
Be Careful Here
Tuesday, September 05, 2006
What September May Hold
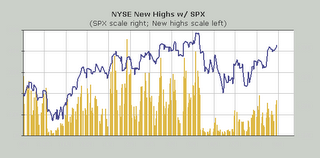
2. Likewise, the S&P 500 and Dow have rallied back to their April failure points. However, note the notable decrease in stocks making new highs during the latest rally (the yellow bars represent stocks making new highs, while the blue line represents the S&P price levels). This is a very strong bearish divergence, which makes a breakout to new highs very unlikely.
Thursday, August 31, 2006
Watch the SMH for Signs of Profit Taking
Wednesday, August 30, 2006
Watch Out for Rising Wedges

Now take a look at the current S&P chart, represented below by the SPY (ETF) exchange traded fund.

The wedge here is in a much sharper uptrend, but the price is contracting nonetheless. Could the bulls rally the price of the SPY back up to $132? We don't know yet. But if they did, there would surely be a great deal of capitulation amongst the shorts. Likewise, given the low volume in which this steep climb has been driven with, the probable reversal could be sharp and swift. Now turn your attention to the QQQQ, which has been behaving a little better lately. Below we are providing a weekly view of this ETF. Note the red line on the chart just above $39. This represents the 50-week average. Note also the blue trend line drawn on the chart. This line represents the last broken uptrend. Stocks and indices often move back up to retest their broken trends before reversing. We don't know what exactly to expect next, but it is clear that any further rally from yesterday's close is sure to run head long into some serious resistance.

Finally, let's take a look at the semiconductor sector, represented below by the SMH ETF. The semiconductors actually look pretty good lately. They appear to be in a decent uptrend that is rising on decent volume. Also note, however, that yesterday's sharp move put the sector right near overhead resistance, as represented by the rising trend channel. Furthermore, $34.28 represents the broken 200-day average. Thus, any further rallies in this sector are also likely to run into heated resistance.
The semi conductors could actually produce some good long side trades after a pull back if it is orderly. For now it is too late to try and catch this trend.
Bottom line: Professional traders are expected to return next Tuesday after the holiday weekend. Any breakout attempts following yesterday's strong close should be eyed very suspiciously. No one knows for sure what will develop next week, but several indices are poised for serious downside if the pros come back with selling on their minds. If, on the other hand, they come back in a buying mood, further upside is likely to be muted by serious overhead resistance. In other words, be extra cautious if you are trading the long side of this market and don't get too aggressively short unless we see some breakout failures start to emerge.
Tuesday, August 29, 2006
Bulls Need to Step Up as Time is Running Out
Monday, August 28, 2006
Don't Read Too Much Into This Week's Action
Friday, August 25, 2006
Slow and Boring Trading with Slightly Negative Bias
Thursday, August 24, 2006
Follow Through Lower is Doubtful; This Week Anyway
Wednesday, August 23, 2006
Immediate Trend Nuetral
Tuesday, August 22, 2006
Problems Remain with this Rally
Monday, August 21, 2006
Let the Games Begin
Friday, August 18, 2006
Has Everything Suddenly Changed? Don't Bet on It.
Thursday, August 17, 2006
Watch Profit Taking for a Clue on What Comes Next
Wednesday, August 16, 2006
Bulls Get Their Revenge; Will it Last?
Tuesday, August 15, 2006
Why are the Bulls so Confident?
 The bottom line is, this market has been very volatile and as hard to trade as any market we have seen. As such, we would not add any more to the short side here, but we certainly would be very hesitant to go long and we would certainly hold current short positions open.
Monday, August 14, 2006
Indices Trading at Resistance

Friday, August 11, 2006
Yesterday's Rally Lacking
Thursday, August 10, 2006
Trend Reasserts Itself
Wednesday, August 09, 2006
Traders Sell the News
Tuesday, August 08, 2006
Looking to Fade a Potential Fed Rally
Monday, August 07, 2006
Fed Meeting Looms Large
Friday, August 04, 2006
Jobs Data Will Lead the Way Today
Thursday, August 03, 2006
QQQQ Should Test Resistance
Wednesday, August 02, 2006
Bear Trap Being Set, or the Real Thing?
Friday, July 28, 2006
Lead Dog QQQQ Still Leads Lower
Thursday, July 27, 2006
Tech May be Forming a Bottom
Wednesday, July 26, 2006
Yesterday's Rally Likely to be Short-Lived
Tuesday, July 25, 2006
Recovery Effort Weak Thus Far
Monday, July 24, 2006
Overbougth Levels Could Spark a Rally
Friday, July 21, 2006
A Better Oversold Rally is Nearing
Thursday, July 20, 2006
Yesterday's Bounce Likely to be Short Lived
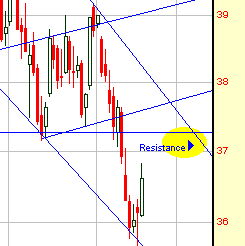 It is best not to get overly aggressive in front of options expiration. Price movements will be less meaningful over the next two days. Settle in with your open positions and wait for stocks to bump back into resistance for a good set up.