Securities Research Services

Thursday, March 16, 2006

Market Shapping up Ugly

It could be options games that is causing the tech weakness here, but there are some real reasons why the bearish case is looking more and more valid. Not the least of which is the fact that the old dinosaur the Dow broke out, which indicates that smart money is running for the safety of the big caps. Add to that the severely lagging tech sector and an inverted yeild curve and caution shows up as the most prudent course of action to take in this market. We have been sidelined over the past week as scans have turned up very thin even as indices were showing strength. Tonight we are going to be scouring for short hedges.

Wednesday, March 15, 2006

Near Term Bullish Breakout

Yesterday the market surprised a lot of people as the S&P 500 broke out to multi year highs and the Nasdaq bounced firmly off support. This is a pattern we have been watching develop for some time on the weekly charts. This is why we have hesitated to sell short when daily charts were at their ugliest. It looks like this move to the upside is the real deal and should continue for at least the next few weeks. We should be able to pull some decent gains out of this move. That said, caution still needs to be exercized here. We need to watch for breadth as the market moves higher. Bears are making the argument that the market is in the process of creating a topping pattern and they cite an inverted yeild curve as the primary reason. We believe that this move is tradable, but it is also a good idea to be critical of the move being ready to switch alegences to the short side if sentiment becomes overly bullish.

Tuesday, March 14, 2006

We Repeat, Stay Defensive

As mentioned yesterday, the market continues to waver at a point of indecision. There is no real trend here, though the QQQQ sits solidly on support for now. There are threats to QQQQ support, namely the semiconductors, which remain weak. The second shoe may be ready to drop on INTC so agressive trading here is precisely what we want to avoid.

Saturday, March 11, 2006

Market at Support, but Stay Defensive

The QQQQ closed where it needed to on Friday and with a high volume spinning top reversal signal. 40.50 is the key price to watch and if selling pressure, which looked to have let up on Friday continues next week the going is going to get awfully tough. Due to the fact that scans do not confirm the strong reversal signal on this index we are not willing to buy agressively here. At this time the market is between a rock and a hard place. It is too late to short as a near term bounce is almost a given. At the same time, until we see money come off the sidelines going long is likely going to lead to more frustration similar to that experienced over the last week.

Friday, March 10, 2006

Blog Update

We have experienced a virus in our system that has caused problems for our analyst. The blog schedule will resume with regular updates next week. Thank you for understanding.

Wednesday, March 08, 2006

Once Again, Trading Range Continues

There isn't really much we can add to recent comments after yesterday's session. The market continues to trade in a range and no matter how ugly yesterday looked and felt, key support levels remained in tact just as key resistance levels have remained in tact on upside attacks. If the QQQQ closes below 40.50 there might possibly be something to be concerned about. We believe however that the follow through day the bears are licking their chops over is not going to arrive and they will find themselves frustrated along with the rest of market participants of late.

Tuesday, March 07, 2006

Trading Range Continues

Scans after Thursday's session look a lot like they did after Tuesday. We don't see stocks breaking down, but a lot of stocks are bumping up against resistance. Unless the market can break above the levels we pointed out in the after market report, stocks are likely going to roll back over and go back to the bottom of the trading range. We continue to look at this trading range as consolidation and base-building.

Saturday, March 04, 2006

Long Term View is Sound
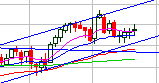
The market reversed in a fairly ugly fashion on Friday. Normally this would be a strong warning signal but we are under the impression that the reversal was more about end of the week games and not about distribution. There is a strong probability that the reversal was merely program traders manipulating the index prices by working a few high profile index components. Scans just did not back up the weakness that is reflected in the indices. Moreover, if you pan back to the weekly view, index charts look rosy. Take a look at what has occurred over the past four weeks with the QQQQ (NASDAQ 100). Four dojis printed above its 20-week average. The past month has been frustratingly boring and lots of theories have been flowing as retail traders debate on the direction of the market. Shorts have been burned and longs have been frustrated by stocks that don't move. From the weekly view however, this action has been indicative of base formation. Indicators, volume, and price patterns all favor an upside breakout in the not too distant future.

Thursday, March 02, 2006

Two Important Levels to Watch

The QQQQ needs to break above $42 before longs can breathe easier. The SPY needs to close over 129.50. Until these two levels are overcome the market should be considered range bound. On the plus side, overhead resistance has been under attack and market breadth has perked up considerably from early week trading.

Wednesday, March 01, 2006

Bulls Regain Thier Position of Power

Yesterday when the indices sold off we expected to find a very bearish picture when going through scans. Instead what we saw were virtually no strong short set ups and a lot of stocks trading in neutral territory. Contrast these findings with our scans after Wednesday's session. Wednesday the market traded very strongly, reversing technical damage incurred by Tuesday's bear attack. Only this time the scans revealed a strong amount of participation in the move. We found a great deal of stocks setting up very nicely for a bullish move. This divergence should clue us in that the market is gearing up for another move higher. This is verified by the fact that money flow figures have been diverging against negative price patterns over the past few days.

Tuesday, February 28, 2006

A Battle Rages

Before running through our scans we were of the opinion that it would be necessary to put on a short hedge or two. After getting a clearer view of the internal character of the market that is better seen when viewing individual stock charts we have determined that there is no clear direction in this market despite the seemingly strong reversal on Tuesday. Stocks are not set up to run at this point but that does not mean that they are set to break down. We saw very few reliable short or long set ups and considering the fact that the broader market is so mixed, we can be fairly confident that set ups that do look promising are in fact unreliable. Bears controlled the day today. They have not gained control of the market yet. There is one near certainty that we can uncover at this point: those who try and enter the fray as both sides battle for control are going to come away with losses. This is not an either/or situation. This is a lose/lose situation until one or the other side gains control.

Monday, February 27, 2006

A Defensive Posture is Important Here

We saw the market moving up today but volume left much to be desired. The reversals on the S&P 500 and Dow are a warning sign as are low volume levels and continued poor breadth. We expect the rest of this week to remain fairly positive but we would like to be very careful here and take precautionary measures like putting on some short hedges. We don't know what the market is going to do next so pragmatism is demanded here.

Friday, February 24, 2006

Bulls Have Their Work Cut Out, but Remain In Control

Breadth and volume were poor yesterday, which means we need to exercise caution. There are however some positives that could keep the market afloat for a while longer. Weekly charts on the NASDAQ continue to show strong buy signals and the prices, though choppy this week, have refused to break down through supports. Another positive is the fact that money is starting to flow out of the Dow. Recall that the bearish case was built on the fact that institutional money was parking in the Dow out of fear that a top was forming. With money moving back out of this dinosaur it indicates that fears are subsiding and that money has an opportunity to flow out of the blue chips and commodities (which continue to correct hard) into the broader market. The last positive for the market here is found in our scans. Scans today revealed a mixed picture. A number of stocks are showing strong inflows of money while another group of stocks that have been underperforming are showing strong signs of being oversold. Market tops are not marked by large numbers of stocks in oversold conditions. The bottom line here is that there is indecision here, but the bulls have the power to pull the market higher. Bears have a weak case and are losing strength, but the bulls have to capitalize. The correction in the commodities sector could influence the fed to tone down its hawkish comments, which could give the market a real boost from current levels.

Thursday, February 23, 2006

Market Bouncing on Poor Breadth and Volume

The market is bouncing into the end of the month here, but we would look for more volatility today. Breadth is very poor and momentum has all but died out. We may get a stronger rally next week but right now long positions are really struggling to make decent gains. Bears are convinced we are at the top. We wouldn't go so far as to make that prediction at this point. We do however want to exercise caution and proceed with care until breadth and momentum improve. The energy sector is correcting, which could lend to a sector rotation into tech. Right now money is moving fairly aggressively out of energy, but has yet to move aggressively into tech. As such we would focus on shorting energy here. We do not recommend opening new long positions until the picture clears up a little.

Wednesday, February 22, 2006

Bears Growl, But We Expect a Push Higher

Blue chip stocks continued to hold near their highs yesterday as tech continued to experience pressure. The slow drift of stocks here can be much more frustrating than a quick downside move since it make support levels bend but doesn't clearly break them. This activity has caused options traders to heavily buy puts into the dips in the tech sector. Logically this makes no sense since they are betting on a breakdown before they have confirmation. Options traders are typically not logical traders though, but rather emotional traders. The actions of this group make for a very strong contrarian buy signal. This is confirmed by the fact that weekly charts are showing strong buy signals even as daily charts are experiencing weakness. The weekly view is always more accurate. We are looking for the tech sector to make a good run as we head into the end of February, which should last into early March. We don't know what will happen after this run. Some are getting quite bearish here, but we plan to just play what is in front of us and not let convictions override reason.

Tuesday, February 21, 2006

Dow Breaks Higher

Blue chips are outperforming tech here, which is causing some to start discussing a market top. We are dubious of this claim at this point and will need to see stronger evidence than strong performances in large cap stocks to make us get long term bearish. The NASDAQ has a weekly buy signal and there is a good chance we will see tech make a strong move to catch up over the next few weeks. Right now we fail to see any distribution activity that marks a market top. As we stated, the market will make a monkey out of the greatest number of people and this is a good opportunity for it to make a strong run and fool the majority. On Friday we mentioned that the SPY was poised for a weekly breakout. In fact the SPY is poised for a weekly breakout, but the report contained a mistake. It was actually the Dow ETF DIA that was poised to break out last week. The DIA closed over the magic number of $110 and broke out over long term resistance.

Friday, February 17, 2006

Looking for a Potential Strong Close Today

All eyes should be on the S&P 500 today. If it's ETF (SPY) can close above $110, and we will have a weekly breakout. The NASDAQ has lagged, but it is moving nicely off of its trend. Likewise, the semiconductors are gearing up for a strong move off their breakout support level. A strong weekly close today would put the market in a strong technical position to make a very nice run. There has been a lot of doom and gloom about the longer term outlook of the market lately. A lot of it surrounding the unknowns related to the changing of the guard at the Fed. Perhaps the market is going to surprise a lot of people and start trending to new highs. If there is a certainty in the market, it is that the market always surprises the greatest number of people possible.

Thursday, February 16, 2006

Blue Chips Breaking Out

The NASDAQ continues to carve out a bottom, the Dow and S&P threaten to make new weekly highs and the semiconductors continue to threaten a new leg up after spending the last 12 weeks consolidating support above breakout levels. At this point we don't have an opinion about how strong the run will be, but the market is certainly behaving very bullishly here. What we do know is that if the blue chips can close above weekly highs this week and the tech sector makes a move out off of support, we are going to have a very nice group of solid trade set ups that offer a good balance between risk and reward. Be patient here because the market is setting up very nicely.

Wednesday, February 15, 2006

Base Getting Stronger

The big news of the day is the Dow. It is once again threatening the 11,000 level. If the current price level can hold through Friday, there will be a weekly breakout on the Dow chart. The S&P 500 is also trading near recent highs. The running theory is that money is flowing out of small caps into the blue chips. If so, we could be in the last stages of the bull market and could potentially see a larger correction in coming months. For now though, it is best not to try and speculate too much and just play the charts in front of us. Sweeping theories about what the market may or may not do don't make anyone any money, they just cause traders to lose focus and make bad decisions. The QQQQ is building a strong base here and while we could still see choppy trading into Friday, we expect a rally to ensue from this area. As such, dips remain buying opportunities.

Tuesday, February 14, 2006

Look For a Hard Reversal This Week

Last week we provided two scenarios that could possibly take place as the QQQQ struggled with its downtrend. One scenario looked at the possibility that traders would become overly bearish and the index would stretch down to a very oversold condition setting up a great buying opportunity. The second scenario, which did in fact play out last week, had the QQQQ bouncing to relieve its already oversold condition, filling the gap, and setting up for a new leg down. So here we are. The QQQQ is making its new leg down after filling the gap at $41.50. Do we get bearish here then? No! Instead, the first scenario is now back in play. The index is now getting very oversold and it has long term trend support just below $40. Yesterday the QQQQ closed at $40.49. While this occurred 55k puts were sold and only 22k calls were purchased. In other words, options traders, who have an absolutely horrible record, are betting on a breakdown. We are betting they are not going to get it. Stated another way, dumb money is betting on a bearish case and smart money is accumulating at these levels. This week options expire and bears likely have a target on their backs. We are looking for a sharp bounce higher at some point this week. Scans today reveal that the selling pressure is not yet behind us, but QQQQ dips down to and below $40 are wonderful buying opportunities.

Monday, February 13, 2006

Options Week Kicks Off

The bounce on Friday appears to have been just short covering as profits made last week were locked in before the weekend. There are still a few issues trading independently of the indices, but the broader market does not appear to have solid support yet. Considering the fact that this is options expiration week, expect games to be played. We will be looking for the QQQQ to make another stab lower and suspect that this week will see base forming around the $40 area. During this period dips should be used to accumulate, but we do not recommend buying breakouts. Though we will likely continue to experience some selling pressure this week, it is far too late to short this oversold market.

Friday, February 10, 2006

Sector Rotation Underway

As you can see from the QQQQ chart below, this market has not yet found a floor. Yesterday's sell off after the gap fill projects at least another minor leg down. We suspect that options games played during expiration week next week will shake the QQQQ down below $40 to get the crowd really bearish. This would be a great buying opportunity. Strangely enough, individual stocks don't look nearly as bad as the index charts do. This looks to us much more like sector rotation than it does a serious trend threat. Money coming out of commodities is starting to move to other areas; we think tech. There certainly hasn't been the broad selling pressures that are taking down the whole market here. Yesterday there was some late day program trading that shook a lot of stocks, but most of them recovered quite nicely into the close as bargain hunters snapped them up. Shorts are likely to get burned in the next week or two.

Wednesday, February 08, 2006

Nearing a Bottom, But What Kind?

We continue to analyze the QQQQ, as it has been the leader on the rally up, and now leads the market down. When it finds support and reverses, it is very likely that the rest of the market will take its lead. Note that the QQQQ has a large open gap up to $41.43 and then a very small open gap up near $43. The large open gap represents a break of the neckline on a head and shoulders pattern and likewise, a break below pivot support. This break indicates that there will be no real support until the price touches down or moves just below $40. One of two things can happen here. Scenario 1: The market will bounce and the QQQQ will move up in a weak thrust to close the open gap above $41. This would be bad for the bulls and we would look to short the bounce under this scenario. Scenario 2: The QQQQ continues to bleed here and refuses to bounce even though it is getting oversold. The price would then stretch down to or just below $40 over the next few days. This would be great for the bulls and would lead to an excellent buying opportunity for what would surely be a strong rally, perhaps back up to or even above January's highs. For now we hope for Scenario 2 to play out, but will prepare for Scenario 1 just in case.

Tuesday, February 07, 2006

Gearing Up for an Oversold Bounce

The strong trend that started last October has not broken down but over the past few weeks it has grown soft. The market seems a bit confused here and a trading range has emerged. The technical picture has become a bit murky as a result of a hawkish fed statement and some poor earnings reports from key companies this earnings season. At this point it is useless to try and make long term predictions about where the market might go. To do so would just be an exercise in futility. In situations like this we have to follow the acknowledge what is right in front of us and forget about what may or may not happen a few weeks down the road. So what do we have in front of us right now? We have a nasty head and shoulders development on the major indices. Even so, the neckline support on these patterns has held on all but the NASDAQ 100. The breakdown of the NASDAQ 100 has not encouraged follow through and it looks like buyers are once again accumulating in anticipation of an oversold bounce. How strong will the bounce be? We have to wait and see. If the bounce is weak, it will be a good shorting opportunity.

Monday, February 06, 2006

Trend Weak, But Not Yet Finished

Despite the head and shoulders patterns showing up on major indices, we have not yet found signs of major breakdowns occurring, which would indicate that it is safe to short the market here. We are likely to get a bounce early this week. Unless the bounce is unusually strong, it will likely provide an opportunity for us to ease into a few short positions.

Friday, February 03, 2006

In a Trading Range Until We Are Not

Conditions haven't improved much since yesterday. At the same time we are really struggling with the reasoning for going bearish at this stage. There are two reasons for this: 1. The put:call ratio is overly bearish meaning that too many are leaning short here. Since the crowd is only right during the end of trends, this contrarian indicator is fairly reliable here where the market is in a trading range. 2. Indices are trading in head and should patterns, but the neckline on these patterns has not yet been breached. Anticipating breakouts or breakdowns is always a loser's game, so until we have confirmation, we remain agnostic about a breakdown. For now we are still in a trading range. Perhaps the Amazon report issued after hours will be enough to cause selling through support today, but right now support just below yesterday's close is still fairly strong.

Thursday, February 02, 2006

Strong Move is Near

We are still concerned about the market rolling over here, confirming the head and shoulders pattern developing on the major indices. However, closer analysis of daily charts and considering the Russell 2000 is once again threatening new highs, a strong case can be made for the bulls here. Put options have been stacking up at these levels, which is a good contrarian indicator that bears are going to get burned as market momentum threatens to iron out overhead resistance. We don't know yet what is going to happen but it is fairly clear that a strong move is close at hand. Likewise, we have a lot of stocks in the market making new highs and very meager numbers of stocks making new lows. Other than a week ago Friday, we don't have evidence of distribution, but we have plenty of accumulation days and yesterday can be included as one.

Wednesday, February 01, 2006

Index Divergence Problematic

The indices continue to diverge as the Russell 2000 inches higher and the S&P and NASDAQ set up to roll over threatening to finish off the head and shoulders pattern we have been warning about this week. GOOG sold off in the after hours session last evening so we should have some fireworks today. Frankly the market is set up ideally for a short entry. Our only hesitation is due to the fact that we are in a traditionally bullish time of the month where surprises favor the bulls 70 percent of the time. So, rather than get aggressively short here, we recommend playing defensively, keeping tight stops and not opening new positions.

Tuesday, January 31, 2006

Important Day Today

The market is expected to analyze and digest the outcome of three major issues over the next two days. This afternoon of course the Fed will raise rates and will issue their statement. This will likely be the biggest market mover. Watch for a quick reaction after the report, which is highly likely to get faded. In other words, if the market dumps after the report, buyers are very likely to step in at the opportunity. Likewise, if the market takes off, sellers are very likely to use it as an opportunity to take profits. Ultimately, we are not likely to get much of a trend going today, though the swings could be violent. After the market Bush will give his annual State of the Union address and Google will report. Taken together, these three events are likely to set the tone for the rest of the week and perhaps the next few weeks.

Friday, January 27, 2006

New Round of Earnings Today

Today the market will be required to digest the largest group of earnings reports of this earnings season. Technically the market is set up for a short squeeze but today's reports have the potential to either embolden new bears or crush short positions. It's really up in the air at this point.

Thursday, January 26, 2006

Potential Short Squeeze Setting Up

From the year 2004 volatility and breadth levels noticeably declined from prior readings. This makes sense since the market up until November of 2005 was in a fairly tight trading range. During this trading range whenever indices threatened to break out, breadth would decline, good trade set ups were difficult to find, and ultimately the subsequent failed breakout would grind hopeful longs into submission as supports failed to hold. Early this month the major indices broke out above resistance and breadth and volume were strong this time. Last Friday however the breakouts failed on a high volume crash day. What hasn't happened yet though is a decrease in market breadth. Small caps are still performing quite nicely and set ups are looking more and more promising. There is some selling pressure, but sellers are far from being in control of this market. This week we are faced with major indices consolidating last Friday's sell off. Theoretically this consolidation period should favor the shorts as they build their short positions and attack each rally attempt. The problem for the shorts right now is that the indices are not only extremely oversold, but breadth figures are pretty good. This means that there are a whole lot of stocks that are not breaking down with the indices and leadership has been changing. To make matters even more difficult for shorts is the fact that we are moving into the end of the month buying window. The market could break down further here, but the probabilities stacked against this are formidable. Aggressive shorts putting on positions in hope of a support break here are going to be forced to cover when the market bounces to relieve some of the oversold pressure. Likewise, when fund money comes in at the end of the month there is a potential for a very strong bull-inspiring short squeeze.

Wednesday, January 25, 2006

Was Friday Just a Really Good Headfake?

We are getting some very strange mixed signals this week. Major indices, including the NASDAQ, Dow, and S&P 500 are setting up classic bear flag scenarios. Strength over the past two days has been nothing short of a dead cat bounce. These indices scream to be shorted. At the same time the small cap indices such as Russell 2000 have broken out into new all time highs. Adding to the puzzling information is the fact that scans continue to turn up very bullish set ups. Last week before the market crash we commented that the market was providing the best set ups we had seen in years. After Friday's crash this has not changed. In fact, the few short setups we are finding are failing to follow through. A great example of this is THC, a stock which showed up as an excellent breakdown set up before yesterday's market open. THC did in fact break down yesterday, but only to be scooped up by bottom fishers. Rather than evoking panic, the breakdown triggered a signal for money to come of the sidelines in a bargain hunt. What to make of this? We frankly don't know. The market appears to be setting up for a big move and the perfect short set up on the major indices might just be "too perfect." Either shorts are going to get burned yet again, or the small caps are in for a major correction as the divergence is ironed out. Underlying strength in individual stocks seems to predict that shorts are going to get burned.

Tuesday, January 24, 2006

Trends and Timeframes
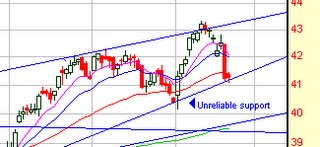
As most of you are aware the stock market has many different trends occurring simultaneously. Which direction the market is trending depends on the time frame you are analyzing. This is always an important distinction to make and it is particularly important to have a big picture view but equally important to know your time frame. After Friday's crash we have to operate under the assumption that the immediate daily trend is down keeping in mind that the weekly trend remains up. This is easier to understand visually, so we are providing a couple of different chart views analyzing the QQQQ. Note that the daily price on the QQQQ found overhead resistance at $43. After pulling back from this level there was some chance that resistance would be broken through on a second attempt. On Friday this attempt failed however and an immediate downtrend was established. There is some support below Friday's low, but it is unreliable as a trading level. The trend is our friend and the short term trend is now down. Current support will likely provide an area where the indices will weakly bounce in a counter trend move. This counter trend move should set up a nice short entry.

For those concerned that a bearish trend means a bearish market, fears of this sort are unfounded at this time. The weekly trend remains up as you can see from the QQQQ's weekly chart. Bears have very likely targeted the open gap at $39.50 and now that they have a trend in their favor they are going to be fairly aggressive about getting their target. A move back to this level would set up a wonderful buying opportunity in the longer term up trend.
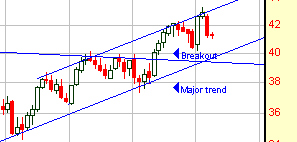
The bottom line is that long positions in the general market are going to struggle near term but long term positions should be in good shape for the foreseeable future. Also keep in mind that bull markets in oil and precious metals are still in tact and still strong.

Monday, January 23, 2006

Friday's Crash Catches Us Offguard

The markets opened fairly flat on Friday, then proceeded to collapse as the biggest crash bar since last summer formed on the daily charts. Some are arguing that Friday can be attributed to expiration games by those who had been selling $41 call options on the QQQQ. Since the NASDAQ 100 was hardest hit we will say it is an interesting theory. However, Friday's crash puts a huge monkey wrench into our overall analysis as it calls into question the viability of the breakout, which occurred in November. Subscribers may recall that on October 19 the market experienced a high volume reversal day, which we determined at the time to be a strong confirmation of support. From that point the market has experienced a strong rally. Friday's high volume reversal day must then be taken seriously as it could be marketing a line of overhead resistance. Does this mean that we are heading into a bear market? Not at all. What it means is that unless we see an equally strong reverse of Friday's sell off this week that we will need to be using the oversold bounces to sell into. The immediate trend remains down after Friday and until that trend reverses, long positions are going to struggle. How this all fits into the longer term outlook of the market, we just don't know right now. Today we expect to see at least a partial bounce. This bounce should be played only by the most aggressive market participants, or day traders. The picture is murky after such a poor day on Friday and it is best to take a step back and wait for more information before making any decisions.

Friday, January 20, 2006

Conditions Dramatically Improve

Earlier this year Jim Cramer, who tends to be quite forceful with his opinions and whose opinions tend to change quite often, touted this 2006 market as the strongest market he had seen in six years. We tend to think he is right. This week things looked a little bleak and there were some legitimate reasons to worry that we were on the verge of a repeat of December's pullback. Last year breakout moves were frustratingly sold into and pullbacks like the one that began last week always turned into something worse as the market forced equilibrium. This pullback was not harsh nor was it frustratingly long. During this pullback accumulation indicators continued to diverge bullishly and poor reports from old the market leaders INTC and YHOO were used by smart money as buying opportunities. Yesterday the indices experienced a sharp reversal and the Russell 2000 small cap index forced yet another all time high. Today's scans confirm this move. We saw some of the strongest charts we have seen in quite some time. What we are now watching for is a NASDAQ 100 channel breakout. Recall that the QQQQ (NASDAQ 100) has been in an uptrending channel, but has been bumping against overhead resistance. If the trend is going to make some real strides, it will be necessary for the QQQQ to break out of overhead resistance allowing the trend to accelerate. The attempt to break this resistance that started January 2 was doomed to fail since it had not time to consolidate. Now we had a nice short pullback and volume has been strong creating a very good higher base of support. The set up is now in place for a breakout. Will it do so? Who know? What we do know is the set up doesn't get any better than this. A QQQQ weekly close over $43.30 would confirm an accelerated trend breakout.

Thursday, January 19, 2006

The Guessing Game is for Losers

We rolled through today's scans looking through chart after chart finding nothing but a whole lot of neutrality. This makes sense if you think about it. Options expire tomorrow, YHOO and INTL reported yesterday causing a significant gap down so a whole lot of people are afraid to make a decision here. Why buy when it is unclear whether the market will get hammered on today's Apple report? Why sell when the current pullback is getting close to overdone and there are two gaps overhead that still need to be filled? What this leaves are a whole lot of charts that are just not projecting much. This leaves us with two choices: We can either guess what we think the market will do here or we can wait for the market to show us. Nobody survives in the market very long if they make a practice of guessing, so we will wait.

Wednesday, January 18, 2006

Momentum Gives Way to Uncertainty

Pressure from an overbought market that is up against resistance, higher oil prices, and options expiration week have all come together to put pressure on the indices. Additionally, breadth figures were poor yesterday meaning that market pressures are weighing fairly heavily across the board. Good trading conditions will return soon, but what we are faced with as we move closer to Friday's options expiration is a poor trading environment where money is much more easily lost than gained. It is time to be defensive, to keep your stops, and to take partial profits when they are on the table. Poor trading conditions are not expected to last past options expiration on Friday. In other words, this is most likely a temporary set back in a larger trend.

Tuesday, January 17, 2006

Momentum Continues

Scans today suggest that the underlying bullish trend continues to have momentum. Pull backs in some areas now appear to be feeding breakouts in other areas. We are finally getting some decent pattern set ups indicating that buyers have been accumulating second tier stocks during the run ups of first tier stocks like Rambus (RMBS). Considering the fact that the NASDAQ has overhead channel resistance just above its current price, we believe that a run higher prior to a pullback would be bullish as it would set up a higher level of support. Nevertheless, with prices as extended as they are, anything could happen here so it is better not to project wants into the market and take a wait-and-see position.

Friday, January 13, 2006

Are Dip Buyers Really This Impatient?

An interesting event occurred right at the close yesterday. In afternoon trading the indices broke down and from 2 p.m. until the close all major indices traded in bear flag patterns. This is a typical pattern that suckers in pullback traders and that generally signals the beginning of a correction. What is unusual this time is the heavy volume after 2p.m., which culminated into a very large buying spike at the close. Could it be that buyers are so eager to get in that they are refusing to wait for a proper pullback? If this does turn out to be the case and yesterday's bear flag fails we could see a mad scramble. Such a scenario would have pullback buyers in the wings battling with the bears who just shorted what they thought was the top. This would create an explosive situation where prices are driven much higher than most market analysts now consider reasonable. What to watch for: If the QQQQ moves (not just quickly dips, but actually moves) below $42.80, then yesterday's bear flag will have succeeded and we will likely see further pulling back from current levels. If not, then today and next week could see some fireworks.

Thursday, January 12, 2006

Hoping for Some Consolidation

While the QQQQ broke above its overhead trend channel and the SMH moved to new highs it would be a bit Pollyannaish to expect gains to go into hyperbolic mode without some pullback or consolidation first. In fact, we would prefer to see gains consolidate for a while and perhaps pull back just sharp enough to scare out the new longs. Up trends are great, but when everyone is bullish at the same time the trend can be jeopardized.

Wednesday, January 11, 2006

Buyers Don't Back Down

Buyers are waiting below soaking up the dips so we could see this rally continue unabated for at least a few more days. Nevertheless, expect quick, frightening pullbacks that shake out weak longs. Looking at the longer term charts, technically there is no reason why we couldn't see a repeat of the type of rally that occurred from the April 2003 breakout, which didn't top off until January 2004. We are already starting to see some of the hyperbolic moves in some of the more high beta stocks that were so prevalent during that rally. Over the past two years traders have been conditioned to sell the breakouts and we have struggled to make 10% gains. Longer term subscribers will remember that during the 2003 it was not uncommon to see stocks make quick 20%, 30%, and even 50% or more gains. We are not trying to put subscribers in an overly exuberant mood where reason is thrown out the window. There are no guarantees that we will see a repeat of 2003 this year. However, we are trying to get everyone to look at the bigger picture and to start thinking less along the lines of "sell the breakout" to "let's exercise a little more patience so that we don't miss the larger moves."

Tuesday, January 10, 2006

Risk of a Pullback Increasing as Bullishness Grows

The crowd is getting overly bullish here and that makes us a bit nervous. Price could certainly continue to climb from current levels. In fact it is likely. The risk of a quick reversal triggered by profit taking increases with each higher high the market makes here however. We consider a pullback to be a buying opportunity, but keep in mind that bull markets sometimes experience sharp pullbacks that trigger stops and frustrate traders. Our time frames are not long term so a pullback that is too sharp can quickly wipe out profits on the table. For the reasons stated here it is better to stay conservative until the market pulls back and provides better entries.

Monday, January 09, 2006

Semis Lead the Way to a Strong Start for 2006

A couple of months ago we noted that the NASDAQ 100 (QQQQ) and the semiconductors (SMH) were leading the rally that started last October. In late November, early December both of these indices broke above multi year resistance levels and we noted that these breakouts would have a significant impact on trading results for 2006. After breaking out, these two indices along with the broad market spent the month of December moving sideways in consolidation modes. Towards the end of the month when the Santa rally failed to arrive bears were preening and bulls were singing woes as both groups looked for the sky to fall. We remained obstinately bullish during December's pull back for what we believe are good reasons. Friday our reasons for remaining bullish were profoundly confirmed on two important weekly charts (keep in mind that a weekly chart view is much more reliable at determining the longer term direction of a stock or an index than the daily view). Over the past 20 or so years one overlying truth has been that the market cannot sustain a move without the semiconductors. This may not be true forever, but at this time we find that the semiconductor sector remains an important leader. It is very bullish then that the semiconductor sector has taken the lead once again and as of Friday this sector has strongly confirmed November's breakout. After a test of support the SMH bounced back strongly last week and on Friday a breakaway gap over multi year resistance was achieved. Despite what the talking heads might say, despite how poorly the bears paint the economic picture, despite all the negativity you are bound to hear over the coming months, keep in mind that the chart says that smart money has been accumulating and now shorts are starting to realize that they have been wrong. We are now in the early phase of a strong move.

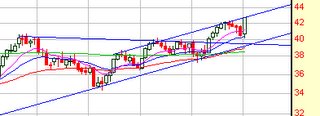
The QQQQ chart is interesting here, for while it also confirms the strong breakout, it is up against its overhead trend channel resistance. One of two things can occur here. Either it can maintain its current slow climb and pull back to support or it can break higher as the trend accelerates. Friday's strength suggests that the trend will accelerate. The strength of the broader market suggests as much as well.
Friday, January 06, 2006

Watching the Semis

The NASDAQ 100 and S&P 500 have both moved up to very significant levels. Both indices are back up near last year's highs, both have been moving up on solid volume, and both have room to continue the run before technicals become overbought. It is important that these indices either break through to new highs or base for a while at these levels. If they get turned back here it would be quite bearish and will make for difficult trading for the next few weeks. In addition to the bullish technicals, the good news is that double tops are rare so let's hope the bulls can keep this rally going for just a while longer. For argument's sake, let's place ourselves in the shoes of the bears here. Perma bears have been trying to catch a top every time the market has rallied over the past couple of years as they look for impending doom to set in. When they have turned out to be wrong their short covering has juiced the rallies allowing the markets to climb a wall of worry. Here we are once again back at last year's highs, an area that constitutes multi year highs. What better place for perma bears to put on new short positions in an attempt to catch the top? Specifically we are once again watching the semiconductor indices. The SMH closed back at last year's highs yesterday. Shorts were likely put on side-by-side against the long bets yesterday. If the SMH can move over $39.15 or simply just close over $39.00 we should see some very explosive action as shorts start getting stopped out and the overwhelming realization that they were wrong once again takes hold. Someday they may catch the top the precedes the big crash, but we are betting that this time will once again be wrong.

Thursday, January 05, 2006

Trend Up, but Some Indecision Here

While there are pockets of strength that should now be freed up to trade slightly independent of the major indices, major indices are up against daily resistance levels and it is yet unknown whether we will get a break through to new highs or a re test of support. Our scans don't give us an edge here on the direction the market will take and they essentially confirm indecision. The bottom line is that the major uptrend is alive and well and we expect gains to continue over the next few weeks. At the same time, the immediate trend could either reverse back near Friday's lows or could break to new highs. A move back to Friday's lows should be considered a buying opportunity. A move below Friday's lows would be bearish, but such a move is not expected.

Wednesday, January 04, 2006

Bulls Take Firm Control

Yesterday's strong move higher was a clear accumulation day and should set up a foundation for a move higher as we start out the 2006 trading year. We wouldn't be surprised of some of yesterday's move is faded today as pros shake the tree a bit more in an attempt to weed out the momentum bulls. Yesterday's move is reminiscent of October 19 where the bulls clearly marked their territory. Keep in mind that the lows were tested a few days later and panicked momentum players were shaken out just before the strong November move. Beware as this could happen again. Have confidence in the fact that bulls have once again marked their territory.

Tuesday, January 03, 2006

2006 Starts On Better Footing Than 2005

We started the year 2005 on the heels of a strong Santa rally that had the market trading at new highs. The market rewarded exuberant traders with a long bloody slide that lasted until April 2005. For those fearing a similar scenario, fear not as conditions are distinctively different this year. We now embark on 2006 with oversold stocks, which have not only evidenced strong accumulation creating a nice divergence, but also with major indices having merely pulled back toward their multi year breakout levels. Don't underestimate the significance of last November's market breakout. Yes we experienced profit taking into the year's end, but indicators reveal strong signs of accumulation taking place during this bout of profit taking. We won't make any predictions about today as the immediate down trend is still in effect until its not, but we will make the argument that this market is setting itself up for a continuation of November's breakout.

Friday, December 30, 2005

Never Short a Dull Market

Yesterday we mentioned a line in the sand where bulls had to make their stand with the QQQQ. Window dressers didn't show up once again and the QQQQ wasn't able to hold support. We don't wish to be ultra stubborn with our bullish stand here but even though the situation looks dire for the bulls there is something that needs to be considered. Going back to last month recall that window dressers did show up until the first day of December, or the third day into the traditional window. On December 1 the market gapped up and continued to run for several days after discouraged traders denied end of the month buying washed out November 29th and 30th. Consider that the market is very oversold here, that there have been no real distribution days aside from December 8, and the fact that end of the month buyers could potentially be waiting for market sentiment to turn a bit more bearish before they step in. Now if a series of real short set ups start showing up in our scans we will rethink our theory here but right now we think there is still potential for a sharp reversal. We hope that subscribers can see why we have hesitated to put money to work in the market as we wait for the market to make its move. The best immediate term indicator we have at our disposal is the health of our daily scans. All week scans have been telling us that buyers are just not stepping in yet. On the other side of the coin, they have not indicated that distribution has been taking place either. A few smart rules to live by: Don't short a boring market, don't short an oversold market if selling is occurring on light volume, and finally, don't short into the end of the month.

Thursday, December 29, 2005

Bulls Have the Setup, Will They Take Advantage?

If you drill down to the 40-day, 2-hour view on the QQQQ an interesting development is revealed. The price pulled back to the 200-period average and bounced early around the 19th/20th of the month. This week the price has once again pulled back to this moving average and yesterday the price bounced once again, this time with strong bullish divergences on most major indicators. There is a line in the sand drawn for the bulls here. The QQQQ must not go below $40.77 or the index will most likely drag back down to $39.50. That said, the set up for the bulls is clear and with end of the month window dressing upon us, odds vastly favor a strong move higher starting today. Such a move higher will produce reliable buy set ups.

Tuesday, December 27, 2005

Looking for Positive Bias to Continue

Last week ended with a slightly positive bias and with indices still oversold. Buyers need to step up here however or the correction that started in early December could persist into January.

Thursday, December 22, 2005

Signals are Mixed

The weak bounce yesterday was uninspiring and leaves much to be desired. It may be that that Santa rally turned out to be just a self fulfilling prophecy and not one that was led by legitimate end of the year factors such as fund mark ups. Making a bearish case it may be that traders sold early strength and we may find that the intermediate downtrend started this week will remain in effect until the QQQQ reaches its lower channel support as outlined in Tuesday's report. The bullish case, which we still believe has some merit, is that the market pulled back to intraday support with bullish divergences showing on various indicators and the late afternoon pullback is just another attempt to shake out weak longs before the real rally begins. Today should be interesting. (Hedging? Yes we are hedging. The signals are mixed here.)

Wednesday, December 21, 2005

Sellers Exhausted

The QQQQ stopped just above its 50-day average and left a doji yesterday. A doji represents a day of indecision. Considering that there is still a favorable seasonal bias even if the rally that everyone expected didn't arrive (perhaps in fact because everyone expected it) and considering the fact that indices have moved from overbought to very oversold we have to entertain the idea that the market has delivered a near term bottom. Yesterday we indicated that follow through from Monday's breakdown would have to ensue before any reliable short set ups would emerge. Follow through lower did not arrive and though buying opportunities are still thin we should see an upward bias into the end of the year.

Tuesday, December 20, 2005

Santa Stays Away
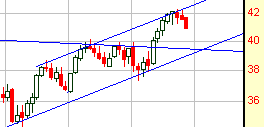
Santa may not arrive on Wall Street after all this year. Several important indices in the tech sector broke decisively below lower support levels. The S&P and Dow threaten to follow. Follow through is always important, but we may find that the market is offering some short swing trades this week. Keep in mind that a pull back here does not destroy the longer term outlook for a continuation of the strong bullish move begun in October. Taking a look at the QQQQ you will notice that after the weekly breakout in early November, the price has now been turned back by upper channel resistance. There are two points where the price can now find support, depending on how determined sellers are. Minor support can be found at the pivot point towards the center of the channel, roughly just below yesterday's close. More likely however the price will track back to the $40 area where the major trend is. The latter is a more likely scenario and one which should produce some intermediate shorting plays.

It's a rare thing to not experience the Santa rally, but as everyone should know by now, the market does experience anomalies and it is better to expect the unexpected than to rigidly hold onto your original bias.

Thursday, December 15, 2005

Dazed and Confused

Yesterday traders were frustrated as numerous breakouts from the day before failed and the tech sectors, which had been leading since October underperformed. Meanwhile, small caps represented by the Russell 2000 showed some life as the index touched a new high before pulling back slightly and the S&P 500 broke to a new high. It was a very mixed and frustrating day for a lot of people. Adding to the confusion is the fact that our scans over the past couple of days have been turning up virtually a handful of poor set ups. Today's scans were of even poorer quality and turned up nothing we would trust. Frankly we are hesitant to make any conclusions about what message these mixed signals are telling us. The last two weeks in the year are traditionally strong as funds try to gun their performance measures and expectations for a Santa rally causes people to come off the sidelines to participate creating a self-fulfilling prophecy. This year could of course be different as the market never guarantees anything, but we sure wouldn't bet against a year end run. Likewise, we never wish to force a trade when there are no clear advantages. Right now there are no clear advantages and we have little choice but to wait this out. It is very likely that other market participants are just as confused as we are right now and this confusion is causing the mixed readings we are seeing.

Wednesday, December 14, 2005

Watching for a Small Cap Breakout

The small caps didn't participate in yesterdays rally but there is a good chance this is about to change. The Russell 2000 is flirting with a break out into new 52-week highs so we may start to see money flowing into the quicker moving small caps as we head into the second half of the week. It is likely that the Fed release yesterday will be hashed over for a few days as analysts try and determine if they are done raising rates for now. The market so far has reacted quite positively to the release and there is at least a good chance that the Fed will take a break here to give the economy time to digest the latest round of rate hikes. Overall there doesn't seem to be anything in the report that threatens to derail this latest bull run so we should start to see the market climbing higher once again now that a base has been building over the past couple of weeks.

Tuesday, December 13, 2005

All Eyes on Fed Today

Today's Fed meeting is likely to set the tone for the rest of the year. All eyes will be scanning the Fed release for language indicating that rate hikes are near completion. Specifically the market has been expecting the word "measured" to be deleted from the report. This has been the word used by the Fed over past months that has been interpreted as hawkish on rate hikes by most analysts. As we approach the meeting today charts are set up for a run into the end of the year. The NASDAQ and S&P 500 are both trading with strong bull flags and are showing good divergences all around. A break up from these flags will be a buy signal and those who have remained doggedly short are essentially going to have no choice but to flip to the long side propelling prices even higher. The Fed report may or may not impact this set up. We just have to wait and see what they put out and how the market interprets it. Gold is most likely going to feel the most impact from the Fed today. If hawkish language is removed then we should see gold shares continue their rally. If not, then the sector weakness we have witnessed over the past couple of days will likely turn into something worse. Today is a really good day to stay sidelined waiting for the market to react to the Fed. If the broad market turns higher here we will have many new advantages so it makes sense to wait a day rather than try and force something to happen in front of the meeting.

Monday, December 12, 2005

Oversold Market Likely to Continue Assent

The NASDAQ 100 has pulled back to its 20-day average as money flow and other indicators continue to positively diverge. This indicates that accumulation has been taking place propping up the price. Meanwhile the SMH held where it had to and should move higher off of its breakout point. The market, which has been overbought recently, has now moved into oversold territory and positive price action and positive technicals favor a break higher as we move into the last couple weeks of 2005.

Friday, December 09, 2005

Bull Flag Fails, But Lower Support Holds So Far

The bull flag failure on the SMH yesterday is concerning. The price closed back at weekly break out support so it is very important that the SMH hold here if the health of the market's uptrend is to remain in tact. We are still reasonably confident that support will hold as underlying stocks look much better than the tech indices at this point. In fact gainers outnumbered losers yesterday even though indices traded in negative territory. Weakness in INTC most likely caused some to misread the direction of the broader market causing some fear based selling. Even though we are still bullish here our bullish position can change quickly if the market follows through and closes out the week on a negative note. It is important to remain objective and not let hopes get in the way of realities. As of the time of this writing, there does not appear to be anything to worry about.

Thursday, December 08, 2005

Bulls Wait to Spring
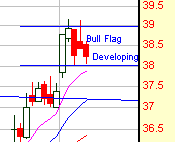
The broader market continues to consolidate recent gains and recent red bar/green bar up and down days are likely to continue for a few more days at least. One of the better leading indicators for the health of the economy is the semiconductor sector. We believe that this sector is in the early stages of forming a bullish flag pattern. A bull flag is formed after a breakout and serves to work off oversold technical conditions and to create a higher base of support. The implications are in fact bullish due to the fact that profit takers are unable to effect a significant price drop as buyers continue to accumulate shares at the lower end of the range.

To support the argument that the SMH (Semiconductor Holders - above) is undergoing consolidation and not something more you need to pull back to the weekly chart.
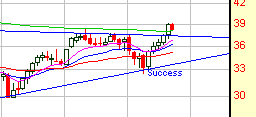
From this view it is clearly seen that the price has broken above significant resistance and is merely taking a rest before continuing higher. The green line represents its 200-week average, territory the semiconductors have not enjoyed since the tech bear market began in the year 2000. Not only is a recapture of this territory bullish, but it represents an objective way to measure the beginning of a new bull market in the sector. We believe that we are very close to the point of recognition when serious bears that have been short this year finally capitulate and move to the bullish camp. We believe that a break up from this bull flag could be the catalyst that will convince them to do so. When this happens the market is going to spring forward to dramatic new heights.

Wednesday, December 07, 2005

Gold and Silver Ramping Higher

The last two days we just didn't have a really good feeling about the near term potential for the market. Indices are overbought and nothing really reliable was showing up in our scans. As such we stayed sidelined. Yesterday the broader market made a move higher but on low volume. Late in the day the move was predictably faded and we have indices such as the S&P 500 and NASDAQ 100 leaving selling tails at resistance. Gold and silver on the other hand made a strong move higher and this sector may be the area to play while waiting for indices to correct. The two gaps on the QQQQ mentioned yesterday are ominous at this point and we are very likely to see them filled over the next week or two. Longer term a pull back here is quite bullish. If the market would keep going here it would more than likely be an unsustainable move, which would invite sellers. A rest and pull back will refresh and stabilize the trend.

Tuesday, December 06, 2005

Market Continues its Rest

We are experiencing a pullback in a very strong uptrend. Some traders with a very agile approach will likely try to short the pullback here but we don't recommend it. Surprises in strong up trends usually occur in favor of the trend. This week is likely to be a volatile one and there is a good chance that the open gaps on the QQQQ from November 17 and December 1 will be filled as overbought conditions are worked off here. This will be a good opportunity for the market to shake loose some bullish sentiment allowing the indices some power to push higher once again. The breakout in the gold and silver mining companies is likely to resume its trend soon but at this time there are no favorable entry points. There are a few set ups in the broader market, but risk of failure is fairly high and it's still early in the week. We prefer to stay sidelined another day managing our open positions and waiting for more favorable entries. Keep in mind that waiting for the right time to enter a position as well.

Monday, December 05, 2005

Semiconductors Break Out, Market Needs Rest

Indices traded higher on Friday but an overextended condition still exists despite the back and filling that took place early last week. There is no reason that overbought can't remain so for long periods of time, however, a pullback from these levels should not be contrived as bearish. The QQQQ is trading at the top of its trend channel here and risk of opening new long positions is fairly high as we begin the week. The most important development to focus on from last week's trading is the fact that the semiconductors finally broke above long term resistance levels. The SMH powered over $37, which had been holding it back for months. This breakout represents a move back over its 200-week average, territory it hasn't traded in since the tech decline started in 2000. Since the semiconductor sector is one of the best leading measures of the economy this breakout suggests that 2006 will be a very good year for US markets. Even so, it is altogether possible, and in fact even desirable that the SMH and underlying semiconductor stocks, pull back and back and fill a bit here before moving higher. A base of support has not yet been established so if this new trend is to remain healthy it should take a rest here. Scans weren't particularly strong today, but this is to be expected since the major indices are up against resistance levels. Now that the market is in a strong up trend though we should start to see some second-tier type stocks beginning to make moves as profits taken are redistributed in some speculative positions. Now is the time to be careful, but not necessarily sit on the sidelines.

Friday, December 02, 2005

Panic Buying Underway

The market powered higher with gusto yesterday as buyers waiting on the sidelines piled on top of each other as they scrambled to get in. Fund managers who have been sidelined do not want to answer to fund holders for missing the year end rally and panic buying is now under way. A hard reversal here is unlikely as dips are likely to get snapped up quickly.

Thursday, December 01, 2005

Underlying Strength is Revealed if You Know Where to Look

The broader market continued to pull slightly lower yesterday and volume levels remain high on all major indices. Most people have the idea that high volume at the upper end of the trend represents distribution and that it is a bad sign that the market is ready to make a turn for the worse. In many cases this is true, but it's not always that simple. There are a couple of reasons why we believe the high volume levels over the past three days represent accumulation and not distribution. First, advanced decline ratios have remained positive as more stocks continue to advance than decline. The second reason is more subjective and much harder to quantify. We scan thousands of stocks each day and individually look through several hundred charts that result. On Tuesday you might recall we noted that we didn't find much to act on but that there was little sign that bears were getting a foothold either. Yesterday scans were slightly more positive as small caps and stocks from a few leading sectors started to once again show strength. Today's scans reveal that that positive trend is once again gaining traction as more and more breakouts are following through and more and more stocks are once again moving higher on heavy volume. In fact, twice as many stocks showed up in our volume scan today compared to yesterday. Of those stocks roughly 90% were making moves higher. This is not what market tops look like. Instead, this is what occurs right before a new leg higher gets underway.

Wednesday, November 30, 2005

Pullback Likely Nearly Played Out

The pullback continued yesterday. We wouldn't be surprised to see the market shake lower this morning and then resume the uptrend with a higher close creating a reversal hammer. Remember the fact that we are just entering the month end buying window and buying pressures have been heavy even after seasonal trends have been accounted for. Many of the minor indices were showing strength yesterday as end of the month buying pressures supported them. The Russell 2000 index in particular looks strong and underlying stocks are showing support.

Monday, November 28, 2005

Bracing for a Pull Back

As could be expected, Friday's short trading day occurred on very light volume. There is not much to be gained by trying to analyze performance on this slow holiday weekend trade day. Longer term charts are in very healthy conditions and investment dynamics at this stage support a long term rally to continue. Short term however we should expect a pullback. It is very likely we will get a harsh retracement at some point this week, which will serve to shake out the weak hands. Dips continue to be buying opportunities but dips can also increase the risk on short term trades. The positive side to the equation is that pullbacks help reveal where the strength and weakness is. During rallies all ships (or in this instance stocks) rise with the tide of the rising market. During pullbacks the strongest stocks will do a better job at holding support levels while weaker stocks get hit the hardest. This is because profits from weak stocks are redistributed into stronger stocks. In the long run this will give us a clearer picture where to distribute our money to get the best risk/reward.

Wednesday, November 23, 2005

The Fed Blinks

The big news of the day, and perhaps the explanation for why market participants are wearing their rally hats came from the Fed. Yesterday's Fed notes strongly indicated that the magical word "measured," as in measured rate hikes, will be removed from the next official release. The consensus is that after two more hikes the Fed will stop raising rates at 4.50%. This is an explosive development that will surely bolster the year end rally and quite possibly extend it well into next year. Despite massively overbought conditions, a "get in at all costs" temperament has taken over Wall Street. Don't fight the trend here, but be assured what comes up will come down. The market has the potential to tack on some serious gains as we close out the year and don't be fooled, this is all very bullish action. Even so, the market NEVER goes straight up so we will eventually get a pullback that will shake loose a lot of trading positions. Trailing stops and small share sizes are the best way to play this market until we get a reasonable pullback.

Tuesday, November 22, 2005

Holiday Week, Trending Higher

Volume will be even lower the rest of the week. Traders can potentially use this as an opportunity to chase prices higher. Areas of tech were weak yesterday, but pullbacks in this type of market environment are usually short lived as they lure in bearish traders and then quickly resume their trends. We can't repeat this enough, dips are buying opportunities now.

Sunday, November 20, 2005

Now is the Time to Buy; Most Will Miss it

Now is the time to be fully invested in the market. We repeat, now is the time to be fully invested. Talking heads on the financial channels are going to continue to focus on reasons why consumers should be worried. Perma bears are going to continue to try and focus your attention on the negatives out there all the time ignoring the positives. We let price do the talking and price is telling us that opportunities that have been elusive since March 2004 now abound. Did you know that most individual investors were very bearish during the 1982-1987 bull market and statistics show they were net sellers of stock during that entire bull market.

Again, during the 1990-2000 bull market, the first half of that period was characterized by individuals selling their stocks. It was only during the 1995-2000 period in which individuals were net buyers of stocks.
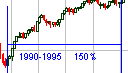
Are you frustrated with lack of performance in your portfolio over the past year? Cheer up, price and volume are telling us that the future is good. More importantly, they are telling us that right here, right now is just the beginning of the next bull market move. Smart money understands this just like they did in 1982 and again in 1995. The average consumer misses the best opportunities and either comes to the party late or doesn't come at all. Here is why the party is just getting started: After two years of a grueling sideways trading range, the NASDAQ 100 has broken out:

After two years of a grueling sideways trading range, the S&P 500 has broken out:

If history repeats itself once again, then those who recognize this opportunity while it's still in its youth will be in the minority. Don't be in the crowd of sheep who will miss this screaming buy signal.

Thursday, November 17, 2005

Watching for a Gold Miner Breakout

In January of 2003 the XAU (gold and silver index) had a weekly peak close of $111.33, following which, it took a long slide down to the $70s. After several months of recovery it once again peaked for a weekly close of $109.68 in November 2004. It again slid back down to the $70 range. Now we are back up at this resistance level. At the end of August a peak weekly closing price of $112.92 was logged. This time the price did not slide back to the $70 range though. Yesterday the XAU closed at $114.29. This represents a breakout on the weekly charts IF the price does not reverse before Friday's bell. Gold and silver stocks we track have been consolidating and breaking out on heavy volume. Yesterday was the most dramatic action this sector has seen in some time. Gold and silver are not free and clear to run yet, but there is a very good chance that this week may be the week that the sector breaks out allowing stocks to finally run. Note: Cash silver made an 11-month high yesterday and did in fact break above its long term overhead resistance level. The stock market is still dealing with options expiration, so we don't expect to see much more action in the broader market until next week.

Wednesday, November 16, 2005

Dips Remain Buying Oportunities, But Wait
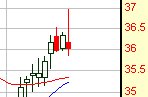
Options week volatility is a bit exaggerated this month as indices continue to be overbought. Yesterday was more of a buyer's strike than it was a sell off. Profits on the table after the recent run up can disappear quickly even in a minor pullback so there was a bit of panic profit taking yesterday afternoon. The area to keep an eye on here is the semiconductors, which have been one of the main market leaders in the recent rally. The SMH reversed sharply yesterday and the closing price left a fairly strong near term sell signal. As you can see, the QQQQ is still well above its breakout point and maximum pain for call buyers is $40. The intraday reversal on the QQQQ yesterday strengthens the chances of options sellers to get the QQQQ down to maximum pain by Friday where they will realize the most profit on their contracts. Such a pullback would be healthy as we believe buyers who missed the breakout are waiting back at the $40 area for a second chance to participate in this rally.

There is little doubt that the market is going to pull back here. We believe that the best position to take during this pullback is a defensive one. There are possibly some positions that are shortable, but risk of surprise generally occurs in the direction of the trend. Since the trend is up, risk on the short side is not manageable for all but the most nimble of traders. After market shocks might be the biggest reason for avoiding short positions at this point.

We may suffer some stop outs as a result of yesterday's hard reversal. Respect the pullback and honor stops here. Buying opportunities are sure to arise out of this pullback, but the next few days are the time to preserve your trading account, not hold and hope.

Tuesday, November 15, 2005

2nd Tier Stocks Under Accumulation

Accumulation continues at these vaulted levels and market indices are working off their overbought conditions by trading sideways rather than pulling back. This is because dips are being purchased by those who missed the breakout. Poor volume levels are positive for bulls at this point as it means that bears are not acting aggressively, even in front of options expiration on Friday. Scans continue to reveal improving underlying conditions as second tier issues are now under accumulation as profits are redistributed.

Monday, November 14, 2005

Dips Are Buying Opportunities

Everyone is calling for a pullback here, which we may very well get. In this market environment shorts and institutional longs are going to start screaming "false breakout" to get you to jump in with them or to get you to give up your shares. Don't listen to them. Dips are buying opportunities here. The market, and tech sector especially, has broken out and everything is lined up for higher prices in the future. Unless a fundamental change is introduced into the market here, such as a massive spike in oil prices, this breakout is firmly in tact. As you should expect to find in a bull market, even as indices are ready to pull back, second tier stocks are just now breaking out. Scans revealed a pattern of good chart set ups unlike anything we have found in many months. Don't forget however that this is options expiration week so volatility is likely to be up sharply.

Thursday, November 10, 2005

Gold Miners To Retest Resistance
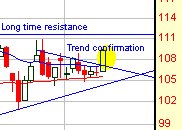
The broad market has moved into a sideways trading range. This should last for a few more days at least. This is a healthy way for indices and stocks alike to work off their technically overbought condition and is a very bullish development. As we stated yesterday, stay patient and wait for the opportunities that are sure to arrive. Gold miners meanwhile, which have been looking rather weak lately, moved strongly off their long term trend and the XAU is ready to make another go at overhead resistance. We believe there is a very good chance that this time will be the one where the miners break out of their long term trading range and move into new territory. We won't know for sure until resistance is tested and broken, but right here is where risk is lowest. Once the price breaks out, it will be much harder to find an entry.

Wednesday, November 09, 2005

Patience Will Win

The market is necessarily in the process of working off its overbought condition. At this point stocks look to slightly retrace or trade in place. It is impossible to project how long this process will take to work out, but until it does trading is likely to be fairly boring. We fully expect the market to make another leg higher from the move started mid October. It is important to keep the big picture in mind and stay patient as we wait for good set ups to emerge. Currently a few sectors, such as gold and utilities, look to break down creating some shorting opportunities. Nevertheless, we believe the real advantages in this current environment are to be found on the long side. It would be better to keep cash ready to deploy once the market starts moving again rather than trying to force a difficult countertrend trade on the short side in the weakest sectors. We have booked some nice profits recently and we expect to add to those gains so we ask everyone to remain patient as we let this very healthy consolidation process work itself out.

Tuesday, November 08, 2005

The Pause Which Refreshes

Indices paused yesterday, which is frankly a relief. The last thing we needed at this point is for the bulls to get overly anxious and run prices so high that shorts once again gain an advantage. What we would like to see here, and what we expect, is a little base building. The QQQQ charged straight off of $38 without a pullback. Sideways trading, or even a pullback to support at $39.50 would give the QQQQ a strong base for a launch higher. There are a lot of traders and investors on the sidelines now that did not anticipate this move, so expect the dips to find quick support.

Monday, November 07, 2005

Tech Leadership Breaks Out!

Once again, take a look at the QQQQ chart: What we have anticipated and have been highlighting since September has finally happened. The upper resistance line on the QQQQ has been broken on a weekly basis. Confirming the breakout is the SMH (semiconductor sector), which bounced firmly off long term support and is now embarking on the next leg up in its long term uptrend. The Dow and S&P broke above their pullback resistance levels and are also in confirmed up trends. This is a market that is firing on all cylinders. This is a market that we anticipate will provide opportunities not enjoyed since the year 2003.

Thursday, November 03, 2005

Nasdaq 100 Testing Breakout Levels

Take a look at yesterday’s QQQQ chart:

It broke downtrend resistance at $39 on heavy volume and closed just below the all-important $39.50. We mentioned these two numbers in yesterday’s report. Moving over $39 should be considered a breakout and bears have their backs against the wall here as money that has been sidelined for months is starting to come in. Investors are starting to get worried that they are going to miss a 4th quarter rally, as well they should.

The real test is yet to come however. $39.50 represents resistance drawn from October 2004’s peak (see weekly chart above). In fact, this basic level has represented overhead supply (resistance) since January of 2004. A strong break above $39.50 would put us into a new bullish era that could last for a couple of years. More importantly, it would take us out of the grueling trading range that for the past year and a half has made it very difficult to take money out of the market and that has led to periods of trading account draw downs. A sustained move over $39.50 would be significant indeed.

What has been holding back a tech break out? The weak semiconductor sector has. Take a look at the SMH chart below and notice the very strong bounce off its long term uptrend. This sector is ready to rally in the 4th quarter and we should see some nice gains to the upside starting from this move.

Wednesday, November 02, 2005

Weekly Likely to be Slow in Front of Employment Report Friday

It is tough to keep a near term bullish outlook after today’s scans. The intermediate outlook still remains bullish, but for the rest of this week bulls have their work cut out for them. The QQQQ has immediate overhead resistance at $39 and support at $38. We will be surprised if it bumps over $39 in front of Friday’s employment report, more likely it will drift back toward $38 support. One of the reasons we believe this is a possibility is due to the once again weak semiconductor sector, which is again heavily testing its long term trend. The SMH must hold $33 or things could get ugly for a few weeks.

Tuesday, November 01, 2005

Monday's Follow Through Confirms the Reversal

After yesterday’s follow through day we can breath a bit easier as the trend works to establish itself. There remains risk that yesterday’s gains will erode today as the day traders have “learned” over the past two weeks to aggressively sell the rallies on the following day. Nevertheless, we believe that prices will become more stable and that the overhead resistance levels on the major indices will once again be tested in coming weeks. This is a market heading for something big. Increased volatility indicates we are heading for a large break out or large break down in the next few months. The charts favor a break to the upside at this point.

Monday, October 31, 2005

Friday's Trend Test a Success

On Friday the major indices survived the trend tests we outlined last week and we saw sectors bounce pretty much across the board. Most importantly, the SMH (Semiconductor Holders) saw buyers step in at its long term trend and the closing price left a strong high volume buying signal in the sector. Since this sector has been the anchor around the neck of the NASDAQ recently, a rally there should let tech take off. We should note however that we do not expect a sharp move off of support levels just yet. The bond market is still trying to find a bottom and as long as bonds continue to lack stability, the trading range in stocks is likely to continue. There is evidence that smart money is using this stock trading range to accumulate.

Friday, October 28, 2005

Important Weekly Trend Test Today

Today is a very important day for the market, one which could make or break the near term bullish case. As you can see on the QQQQ (NASDAQ 100) chart below, $38 represents long time support, the trend it has been following since 2003. For the past two weeks support has held in this area and there are good reasons to assume that the price will hold here once again; not the least of which is the fact that end of the month buying should kick in today. On the other hand sell signals are flashing across the board after yesterday’s heavy retreat of the buyers. The market should bounce here, but we know that the market doesn’t always do what it should do, so we need to prepare ourselves for the other potential scenario that could develop out of a break down here. Should $38 give way this week, short set ups will be confirmed and we should look for the QQQQ to drop back to $36 over the next few weeks. Today is a great day to sit back and watch to see what develops out of this trend test.

Thursday, October 27, 2005

Be Patient in Front of the Month End Buying Window

Traders have been nervous over the past couple of days as the bond market has been falling. Today’s scans revealed a plethora of short set ups and few stocks worth looking at on the long side. Looking at the market in a narrow time frame, forgetting to filter out market noise and swinging with the crowd here it would be very easy to jump from the bullish camp to the bearish camp. Interestingly enough however, when panning back to a weekly view, stocks that are setting up short are oversold and showing bullish divergences. Likewise, it is our view that it would be trader suicide to short the market a day before the month end buying spree kicks in. In other words, we believe we are seeing the making of a bear trap; a situation where shorts are enticed in right before bulls fire back. The bond market is bottoming and as mentioned numerous times this week, we expect buyers to come back in either today or Friday. There is a strong risk for bears that they will be caught on the wrong side of the tape and will get squeezed like they did a week ago Wednesday. This is a market that is rewarding the patient right now. Good set ups on the long side will come as the traps are sprung. We may or may not see lower prices today, but we believe that by Friday or Monday the bears will be screaming uncle! As always, we will wait for confirmation before we buy in to this theory. Today we will wait for better set ups.

Wednesday, October 26, 2005

Back and Fill Day

As expected, we saw some of Monday’s gains retrace yesterday. The fact that a majority of the gains held however is a positive for the bullish case. Likewise, the fact that the market closed strong shows that smart money is still using the weakness to add to their long positions.

Tuesday, October 25, 2005

Tech Pulls Market Higher

Yesterday was catch up day for the blue chips. The Dow was up 170 points and the S&P 500 up 20. Tech heavy NASDAQ however remains out in front and considering that the 5-day end of the month buying spree should kick in by Friday, there remains a strong possibility we will see tech break out of its trading range soon. Note the weekly QQQQ chart below. Two weeks ago it bounced off its 50-week average and long term trend line. Yesterday it closed just .34 below $39.50, a number which represents overhead resistance on its trading range. Its refusal to drop back to the lower support on its trading range betrays the fact that it has underlying strength. A weekly close over $39.50 will mean good times ahead for the bulls.

Today may give back some of yesterday’s gains. This market is once again climbing a wall of worry and a retracement of some of the gains will encourage the bears to get more aggressive again. This would be bullish since short covering combined with end of the month buying power could be the catalyst that pushes the QQQQ through overhead resistance.

Monday, October 24, 2005

Sector Rotation Into Tech

We start the week with the major indices, “The Generals,” diverging from one another. Most striking is the fact that the S&P 500 shows a weekly breakdown from a triangle pattern; volume over the past three weeks. Meanwhile, the tech heavy NASDAQ has enjoyed the influx from a sector rotation out of the oils and back into tech. Earnings reports have been positive for the most part and projections are looking good so smart money is moving back into this sector that has lagged since the market crash at the beginning of the new millennium. The QQQQ is right at support and showing some very nice weekly bullish divergences on its indicators. A retest of its recent highs is likely imminent and a breakout to new highs is back on the table as a reasonably probable scenario before the year is out. We are moving into the monthly buying window, which should have indices moving higher later in the week.

Thursday, October 20, 2005

Market Buys the News as Bulls Come Back Strongly

Shorting yesterday would have had disastrous results. There’s an old saying: Never short a boring market. While this market has had an increase in volatility lately and the VIX has in fact broken out of its trading range (indicating an increase in volatility), the market over the past few days has been merely drifting. We were looking for the market to break lower yesterday, but because the signal was not clear we felt it better to stay sidelined. This proved to be the best course of action under the circumstances that ensued. Is the market ready to turn up here? That’s the big question that is now on the table. Today the S&P and NASDAQ alike put in a wide range bar, not unlike the way the market traded in early May and early June as the market rallied off the lows of what is turning out to be the market’s trading range. In fact, today was the largest wide ranging bar in nearly a year for the QQQQ. The last time such an event occurred was October 27, 2004. We encourage everyone to pull up their charts and see what occurred from that point.

Wednesday, October 19, 2005

Waiting for a Better Signal

There is a big difference between what the market should and could do and what it actually will do. For example, the market sold off hard at the beginning of the month and then last week strong signs of support appeared, which were confirmed by generally oversold conditions and overly bearish sentiment. As such the market COULD have and even SHOULD have started an oversold rally. What the market actually did do however is put in a weak dead cat bounce that is quickly running out of steam. Now we are faced with an altogether different set of market signals than we were at this time last week. The oversold conditions are working themselves off without a significant price level improvement. Now we find that the market COULD and even SHOULD sell off further from current levels making another leg down in the downtrend started October 4. But will the market do what it could and should do here? Since this is options week the answer becomes a bit more tricky. We think the market will make a new leg lower before it finds a significant level of buying support. If the market follows through on yesterday’s weakness the odds will more heavily favor such a breakdown raising the probabilities of success on the short side. Today is a good day to stay sidelined as we wait and see if yesterday’s weakness was the real deal or just a one-day wonder.

Tuesday, October 18, 2005

Volume Levels Problematic

If the market can hold on today gains made over the past two trading days this week then we are likely to see a run back to long term overhead resistance. If however the prices start to weaken at their current levels and start to roll over, then it will mean this market rally we are in was very short lived and had no steam behind it. Poor volume levels yesterday indicate that bulls may already be running out of steam.

Saturday, October 15, 2005

Oversold Bounce, But...

It’s a tough call to make here as we move into options week. Stocks are oversold as well as indices, but the S&P closed the week below support – most technicians would agree that’s a warning sign that lower prices are yet to come. The NASDAQ on the other hand closed right at its long term trend line, though it is hanging by a thread. It must reverse and make a move higher from this level or a downtrend will be confirmed. Right now we are in the camp that believes the selling is not yet over, but that a near term bounce is fast approaching. We saw beginnings of such a bounce on Friday.

Friday, October 14, 2005

Oversold Condition Starting To Attract Buyers

There have been signs since Wednesday that some of the more oversold stocks are running out of downside momentum. The QQQQ, SMH, and have recently sliced through their respective 200-day averages like a knife through butter. Panic ensued and stocks were dumped more out of fear than from reason. A quick study of index history shows however that the 200-day average is not an area that falls quickly. Bulls will battle back for this average and further selling is going to get swept up by smart money who understand this. Who will win the battle is yet to be determined. It is almost a sure bet however that prices will start to bounce back up as the battle back from the lows begins. If bulls have enough weapons in their arsenal we could see a rally ensue from the ashes. If not, and prices merely limp back to their 200-day averages, then we are likely to see the downtrend resume. Right now however it pays to bet on the bounce; after which we will wait and see what develops from that bounce.

Wednesday, October 12, 2005

Bulls Losing Control Near Term

About the only thing positive we can say about the market at this time is that stocks are getting rather oversold and the QQQQ is at its 200-day average. Other than these two factors, the charts look to trade lower. Our bias is moving toward near term bullishness but we remain neutral in our assessment for the long term at this time. Though we believe indices are due for a bounce near term, the trades are still on the short side here. The short side is providing a plethora of set ups pretty much across the board. The market will have to bounce with conviction to reverse the poor technicals that have been developing recently. For now we believe it prudent to bet against a strong bounce as we believe that sellers have control for now and any bounce will be short lived.

Tuesday, October 11, 2005

Negativity Creates Opportunity

Yesterday the indices put in another real distribution day. Since the indices had sold down to support levels on Thursday a distribution day at support cannot be a good thing if you are a bull. As we said yesterday, we are not strongly biased about this market. It has in the recent past sold off below support levels only to recover and follow through with new gains. Even so, we are glad to see some real volatility return. The VIX has broken above its $15 resistance indicating some real emotion has been injected back into the game. This market is one that has been limping up to test support over the past year and over the past few months has experienced a noticeably decreasing level of breadth as fewer and fewer stocks participated in the gains. Now that we are getting some downside movement breadth has returned to 2-1 participation in the move. The key point to understand here is that the market is moving and that is a very good thing. We are not ready to use the word bear market here, but, keep in mind that bear markets create some of the best bullish bounces and provide for some of the best trading opportunities on both the long and short sides as prices oscillate on extreme fear and speculation. So, if the market does in fact not break out to new highs as we speculated last week, a break down to past lows can provide as many or more trading opportunities. Anything is better than a lazy trading range.

Monday, October 10, 2005

Conditions Neutral

After last week’s hard sell off stocks and indices are oversold. Of course in a downtrend oversold can become more oversold. So far however, only the NASDAQ has broken down. Unless other indices follow we cannot count the current environment as a downtrend. Stocks could potentially still pull back higher. If they are going to, they need to build a base at the current level, which will help repair some of the technical damage incurred last week. Scans today were not overly negative, nor were they overly positive. We start the week with fairly neutral conditions and we have no bias as to what will develop next at this time.

Friday, October 07, 2005

Market Congestion Problem is Clearing Up

After three months of moving sideways the market has finally felt an injection of activity. It is highly likely that a major move will emerge from the ashes of this week’s hard reversal that will likely last into the end of the year. At this point there are good arguments for why the move could go either way. If prices stick today and buyers come back in aggressively then we could see a breakout to the upside, which takes out old highs and puts back into play the scenario we were outlining last week. If the buyers remain timid and sellers continue to play offense taking out the 200-day averages, then we could see a turn south over the next few months that will do a lot of damage to the portfolios of long term longs. Either way, the congestion pattern is breaking up and trading volatility is returning, which can only be a good thing for our trading style.

Thursday, October 06, 2005

Nearing a Bounce?

Yesterday’s strong bearish follow through drove the major market indexes down through their daily support levels. This selling could potentially take the market down to a climactic reversal point in tomorrow's session. There is a good probability that the open will provide an exhaustive gap to buy into. When there is blood on the streets, bottom fishers come out in droves.

Wednesday, October 05, 2005

Market Reverses Hard Mid Day

The market did a 180 degree turn mid day yesterday as bulls ran out of gas and shorts took the wheel. Bullish set ups from yesterday’s scans gave way to selling and today’s scans turned up a very bearish near term picture. The market is now undoubtedly heading back to August lows where we hope that it will find support. It is once again time to buckle up and get defensive as yesterday’s overall sell signal is one that should not be second guessed. Likewise, the gold and other metal sectors took a turn for the worse yesterday even as inflationary worries were reported. Add to that, even oil turned south yesterday. We may be in for a few days of wholesale selling.

Tuesday, October 04, 2005

Tech Bears Have Their Backs to the Wall

There is an underlying bullish bias that cannot be easily seen when merely analyzing market indices. The SMH and QQQQ both left bearish selling candles yesterday at their overhead resistance areas. This indicates that we may see indices retreat somewhat this week. However, drilling down deeper and looking at the underlying stocks themselves reveals an altogether different picture. After a dismal June, July the market rallied strongly off of support. At the beginning of this rally we found a number of stocks putting in double bottoms and we found other stocks trading in and/or breaking out of accumulation patterns. These same type of patterns have been showing up in our scans over the past couple of days. Today, after yesterday’s late day bearish market reversal, we find only bullish set ups in our scans. This is a strong divergence between the market indices themselves and we think it projects an underlying bullish current that is building in the market. We need the weekly signals, which we highlighted in yesterday’s report, to confirm before we can aggressively buy this market. At this time it looks hopeful. Note that chip stocks, despite yesterday’s late day SMH reversal, are doing rather well here. We uncovered several double bottom patterns in today’s scans that reveal and underlying current of continued recovery in this sector. ADSX and ATML are two good examples of what is taking place in this sector.

Monday, October 03, 2005

Very Important Market Test Coming Up

On Friday we mentioned that several major market indices produced a weekly buy signal. In particular, the tech sector has been at the front of this move as both the semiconductors and broader tech market represented by the QQQQ closed firmly for the week. Of even greater interest is the fact that the sector is now consolidating directly below major overhead resistance; the same resistance that has fenced in prices over the past two years. A break above this resistance would have very significant implications on our trading success rate. Over the past year especially the market has been trading in a coiling pattern as prices bounced between support and resistance without making any forward or negative progress. This has left many trades cold as breakouts and breakdowns have been faded, causing both to fail. Should the QQQQ break through overhead resistance, we will find that stocks will start to make some good moves, develop better trade set ups, and actually follow through from those setups. We look forward to the next few weeks to see what develops out of this situation. Note that the QQQQ is trading just below weekly resistance. A break here could have a significant impact on trade development. (A failure here would have prices moving back towards $36 support where we would expect a regrouping effort followed by another attempt at $40 resistance.)